We next want to populate the newly created Cube with fact data. We will pull the fact data from the first Cube (the SALES Cube), which was created earlier, into specific intersections of the PRODUCT_SALES cube by using a Cross-Cube Formula.
Because there is a difference in the dimensionality of the two Cubes (The second Cube has an additional Product Dimension.), we will need to define the specific intersections where the data will go.
First, let’s assume for the sake of this exercise: In the past, our example company carried one product (Current Product) but now wants to launch four additional products (New Product 1, New Product 2, New Product 3 and New Product 4). The Finance Director wants to use Current Product data as the basis to create analyses and plans for the new products. Our objective, therefore, will be to pull in data from the SALES CUBE, targeting results to the Current Product Member of the Product dimension in the PRODUCT_SALES cube.
To create the Cross-Cube formula for the PRODUCT_SALES Cube, follow these steps:
1. In Olation Studio, double-click on the PRODUCT_SALES cube.
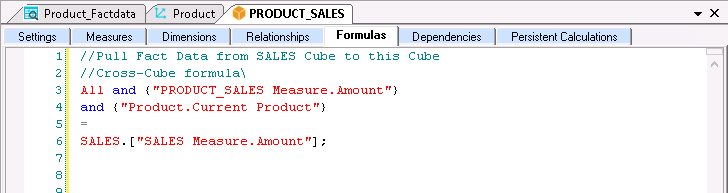
2. To define the formula, go to the Formulas
tab.
In the formula pane, you can type in a descriptive comment to identify
what it is for. Make use of the symbols // or; /* and */.
3. Write the LHS Expression (aka Range Reference). You can use the command buttons along the Cube tab on the Olation ribbon:
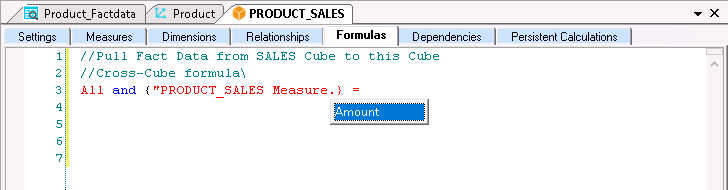
a. Click on the Formula button and select All And {} as the qualifier.
b. Double-click to select PRODUCT_SALES Measure as the Dimension and double-click for Amount as Member (as shown in the following image).
c. Place your cursor on the line below.
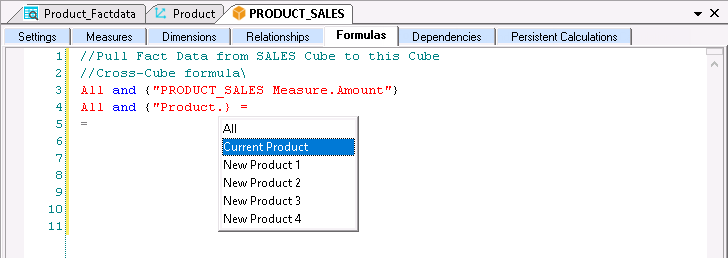
d. Once again, click on the Formula button
and select All And {} as the qualifier.
e. Select Product as the Dimension and Current Product as Member.
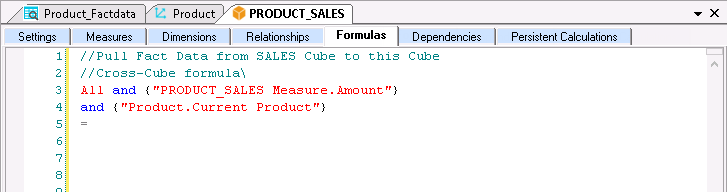
f. Delete All at the beginning of the second expression.
g. Delete the first equals symbol (“=”) to the right on the top line, so the formula looks as follows:
4. Move your cursor after the equals symbol (=).
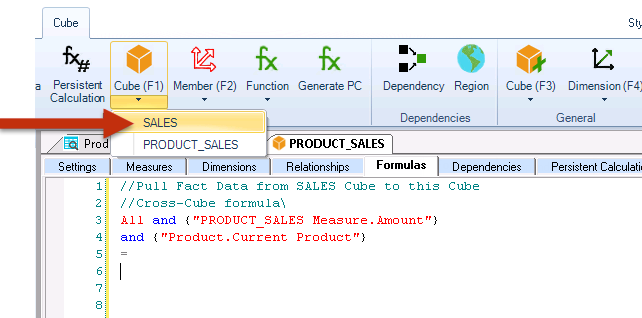
5. To write the RHS Expression (aka Cube Reference):
a. Click on the Cube button and select the SALES cube.
b. Double-click to select SALES Measure as the Dimension and double-click for Amount as Member.
6. Type a semi-colon (;) to indicate the end of the formula. The formula will appear as follows:
![]() Note
Note
![]()
You may hit Enter
between lines, it will not affect the formula.
7. Click the Check icon (the green checkmark) aka Check Syntax button to verify that the formula is free from syntax errors. You will get a prompt that says, "The formula syntax is correct."
8. Save the Cube.
Viewing the Results of the Cross-Cube Formula
1. Go back to the PowerExcel Slice we have created for the PRODUCT_SALES cube.
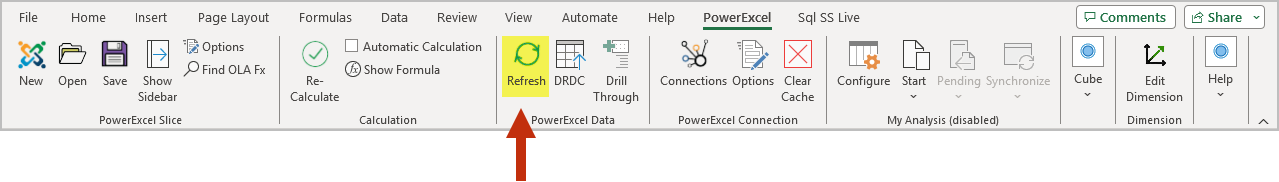
2. To update the PowerExcel Slice data, click
on the Refresh icon found
on the PowerExcel tab. You can also just simply press F9.
![]() Note
Note
![]()
Make sure that your PowerExcel Database connection is active.
You can now see data come into the Slice.
3. Given that we created a Cross-Cube Formula
to get data from the SALES cube and
push it into the specific Product Member—Current Product—of the
PRODUCT_SALES cube, we can make a comparison
of two Slices.
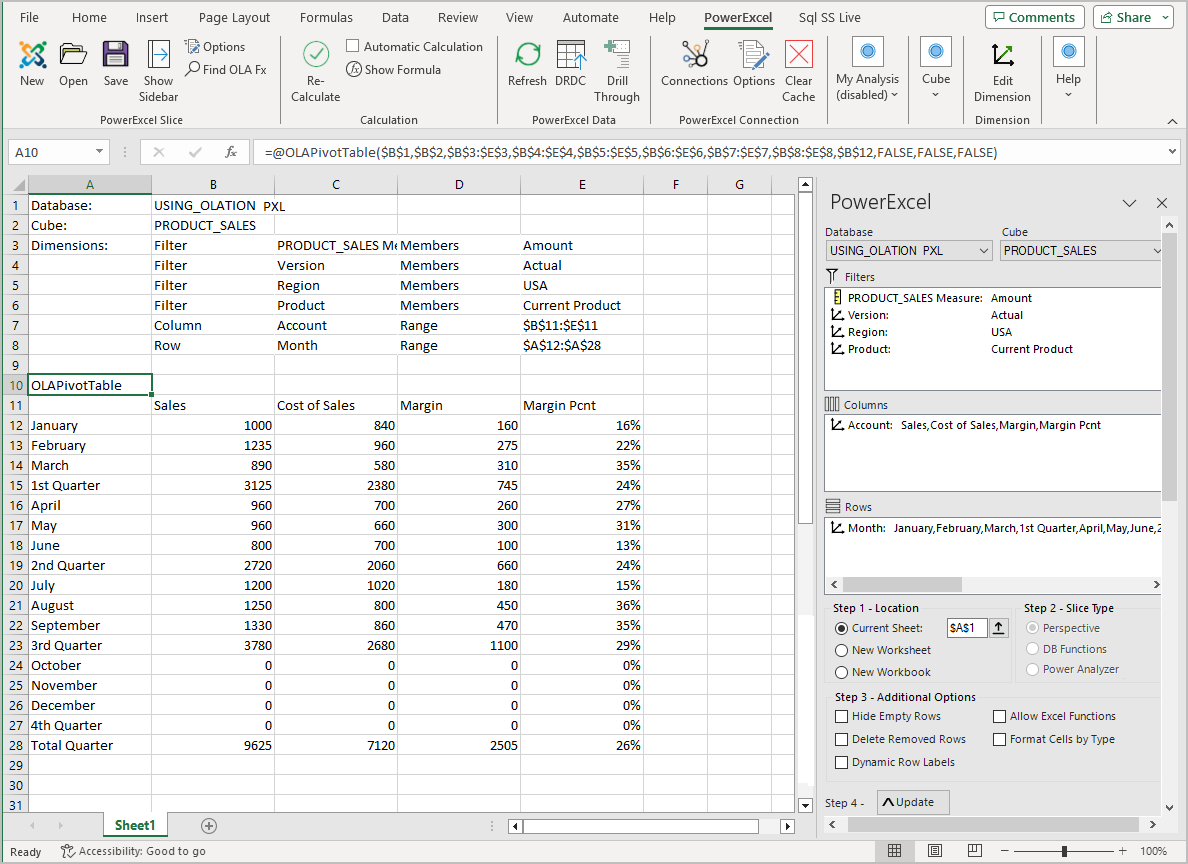
4. Change the latest Slice like so:
a. In the Filters box for the Slice (from
the PRODUCT_SALES cube), select the
following:
PRODUCT_SALES
Measure: Amount
Version: Actual
Region: United
States
Product: Current
Product
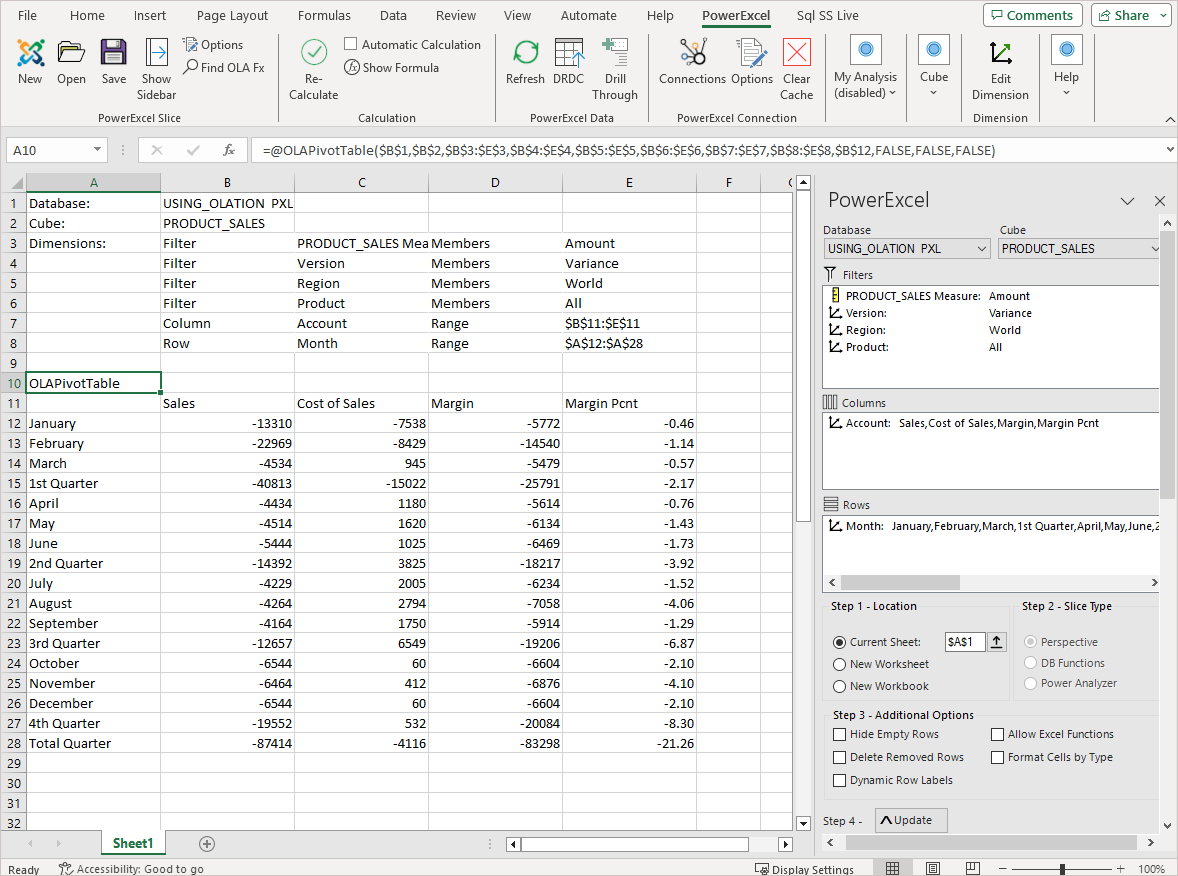
b. Make sure the display Members along the columns for the Account Dimension to show: Sales, Cost of Sales, Margin and Margin Pcnt.
c. Make sure the display Members along the rows show the following:
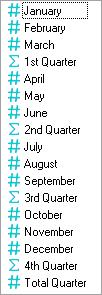
The PowerExcel Slice will update to show the following:
5. Show (or open) the Slice created earlier
from the SALES cube to do a side-by-side
comparison with this new PowerExcel Slice from the PRODUCT_SALES cube.
Notice that, indeed, the data matches across the two Cube, as shown in
the images below.
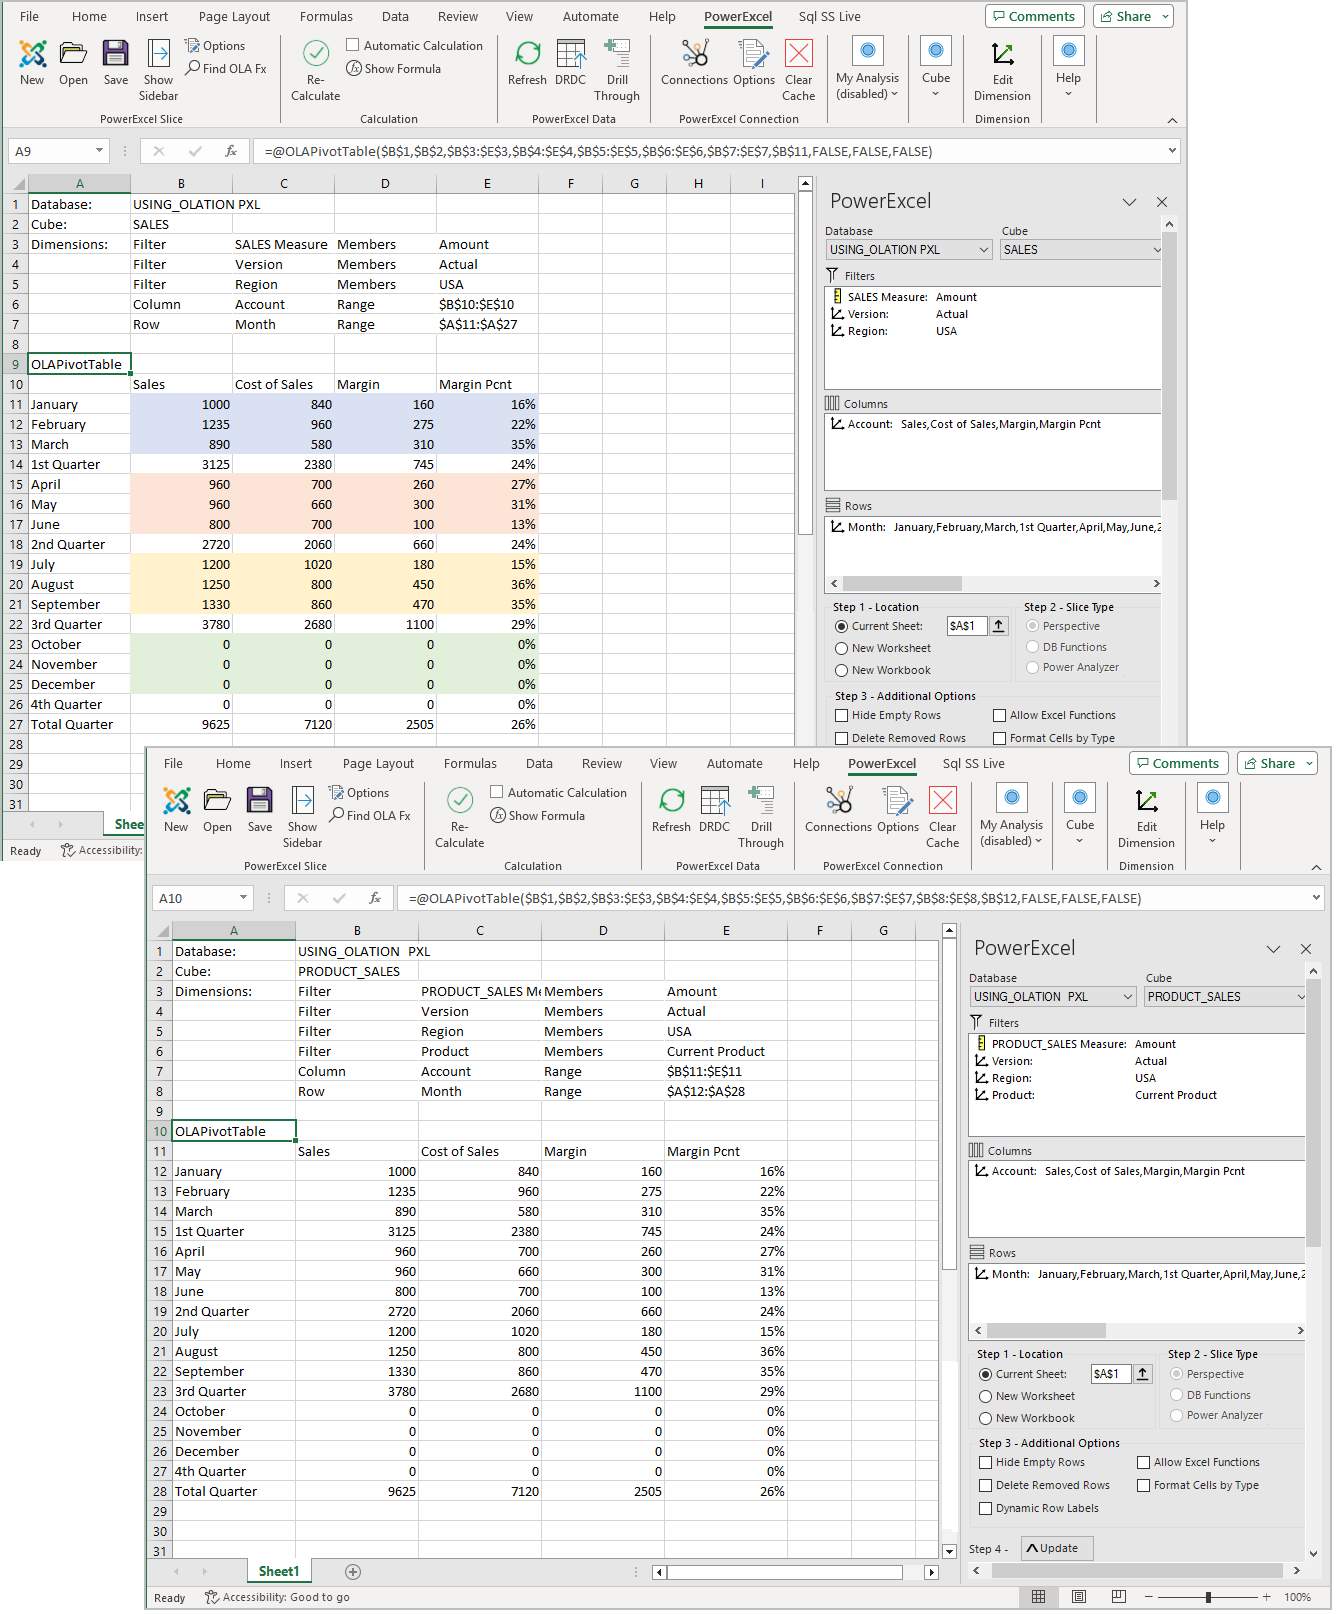
Slices from the SALES cube and the PRODUCT_SALES cube showing United States, Actuals

Slices from the SALES cube and the PRODUCT_SALES cube showing Canada, Actuals
6. If, in the Filters box, we change the Product Member to show any other Members (e.g., New Product 1, as shown in the example image below), notice that these intersections show empty values.
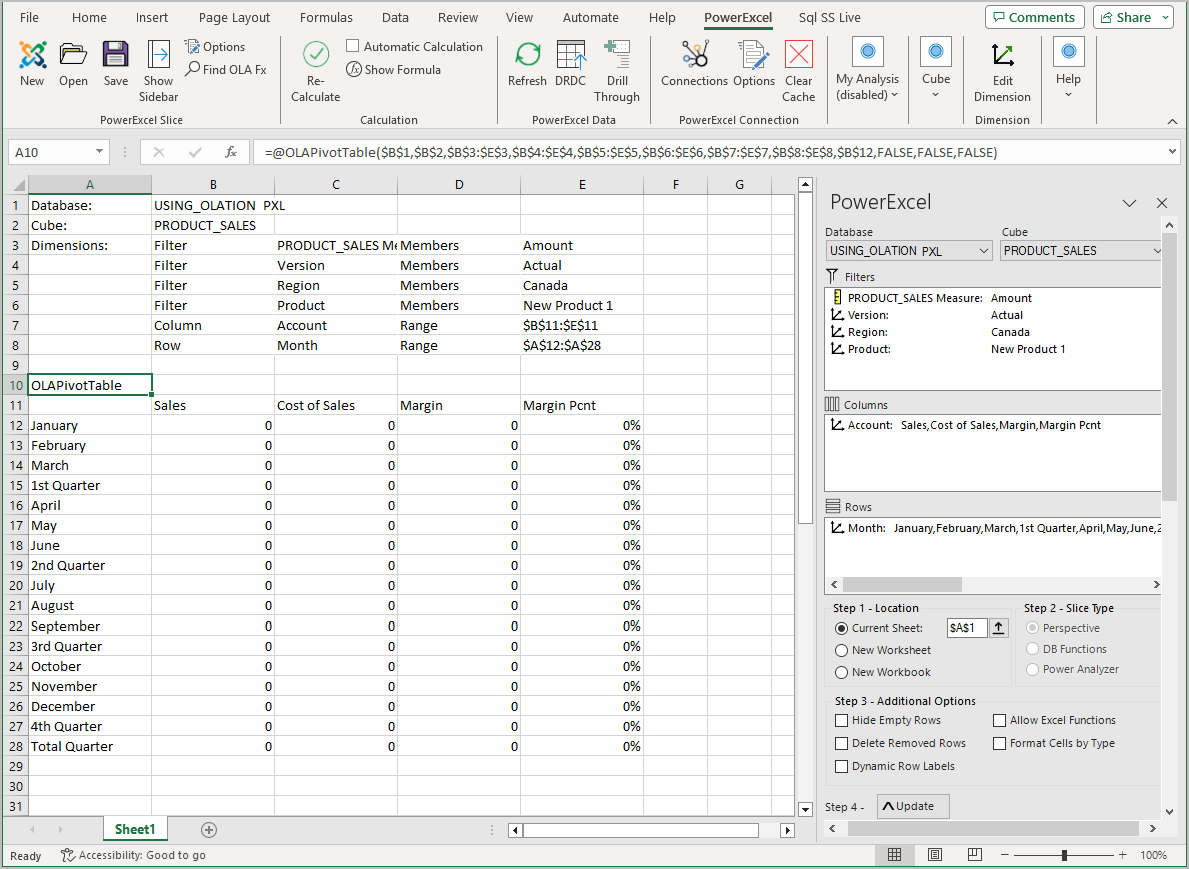
The Finance Director can use these templates for different products (the new products in the PRODUCT_SALES cube), providing access to a shared Olation planning model for users across all regions.
In sum, we have demonstrated the creation of different data models or Cubes, all working together dynamically, for the various purposes of planning, analytics, and reporting.