This final topic (again, explained fully in both the PandA Quick Start and the PowerExcel User manuals) concerns how PowerExcel models are populated with data—Actual figures, for example, from an ERP or other application. After all, the main thrust of this manual has been concerned with creating the “meta data” of the model (Dimensions, Members, and Member Attributes). The past few pages, showing PowerExcel Slice images, featured views that already have data in them. How does this data find its way into a model?
For present purposes, we will limit our discussion to the two simplest ways to enter figures.
First, it is possible to copy-paste numbers into a PowerExcel model. Consider a group of users at a firm mired in numerous linked, problematic spreadsheets, which are sent to staff by email for data entry of budget plan numbers. All the Actuals—used for comparison to the intended budget entries—can be organized for a bulk copy-paste into a PowerExcel Slice (or Slices), so that the resulting online business PowerExcel model will then be fully responsive for collaborative planning exercises. The (pre-PowerExcel) spreadsheet-only system would no longer carry the burden of both storing the numbers and performing all the cell-by-cell, repetitive calculations. This is why spreadsheets grow so large and take ever longer to update! Rather, the PowerExcel model would become the centralized store of both the data and model’s calculation logic, including business rules and KPIs.
Here we come to our second method of entering data in a PowerExcel model. Each user could use the centralized model for budget plan entry; meaning, users would simply type numbers into their own PowerExcel Slice, which would function as a budget template. In sum, PowerExcel supports “write back”.
The following image shows an example Slice in which Dimensions have been oriented to reflect Actual and Budget figures for Jan, Feb, Mar and Q1 in Columns, and individual Operating Expense accounts (from Payroll and related expenses, Distribution…to Other operating Expenses) in Rows. The Filter section (circled in the image below) indicates that this budget template is for 2021, Entity A and the Sales department .
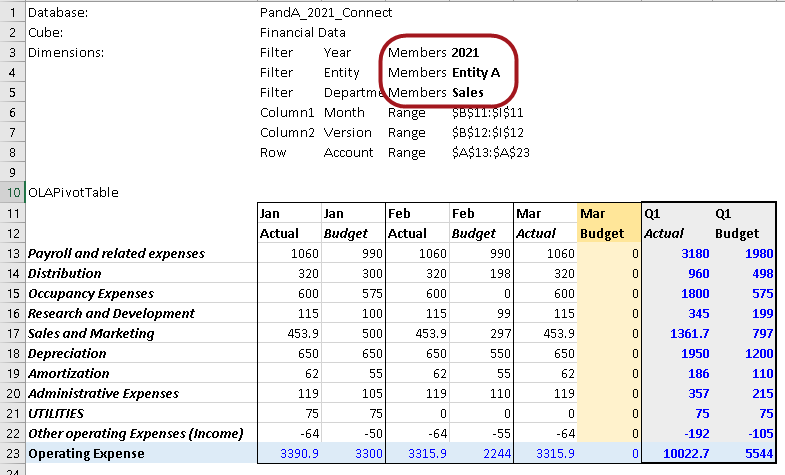
Example Budget Planning Template—a Slice of a PowerExcel model
Given that there might be 10 Entities and 40 departments; thus, 400 Budget contributors, i.e., 400 dynamically connected Budget template spreadsheets. Each contributor, from whatever geographic location, would enter numbers for the Operating Expense accounts (10 numbers x 400 = 4,000 entries) indicated by the orange shading…and the model would calculate in an instant, all the up to the Income Statement budget.
As such, a PowerExcel model becomes far more than a method to “disburden” spreadsheets—it also becomes a way to help decision makers chart choose the best course for a company’s success.
It sounds like a lot to ask of a business modeling application—but, indeed, PowerExcel delivers!