We will now consider more advanced capabilities, Cube Formula functions being the first. Cube formulas represent a powerful extension of the ability to perform mathematical calculations throughout a model. With Cube formulas, you can perform all manner of calculations to populate a cell, ranges of cells, and even entirely different Cube models.
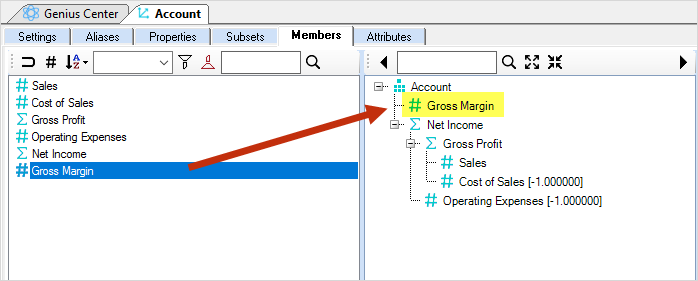
Using the model we have created up to this point, we will add a new Member to the Account dimension, which is Gross Margin (expressed as a percentage), and then populate that Member with a Cube formula that returns values according to the following standard calculation:
(Gross Profit/Sales) x 100 = Gross Margin (Percent)
To create the new Gross Margin Member:
1. In the Database Explorer, expand Dimensions and double-click on the Account dimension.
2. Go to the Members tab and expand the Dimension hierarchy in the Hierarchy Definition box.
3. Right-click anywhere on the Members List box and select New Member from the options.
4. Enter “Gross Margin” in the text box.
5. Drag the new Member, Gross Margin, from the Members List box to the Hierarchy Definition box, right above Net Income.
6. Do not forget to save the changes made to the Account dimension by clicking the Save icon on the ribbon.
We are now able to create a Cube Formula to populate the new Gross Margin Member.
7. In the Database Explorer, open the Sales Cube by either double-clicking it or right-clicking on it and selecting Edit Cube from the options.
8. On the Cube Definition window, go to the Formulas tab (framed in red in the image below), which presently, is empty.
![]() Note
Note
![]()
There are icons on the ribbon on the Cube tab, several of which can be
used in the creation of Cube Formulas. All icons, including those related
to formula expressions (as well as a full explication of Cube Formula
capabilities) are explained the Olation
User Manual and Help file.
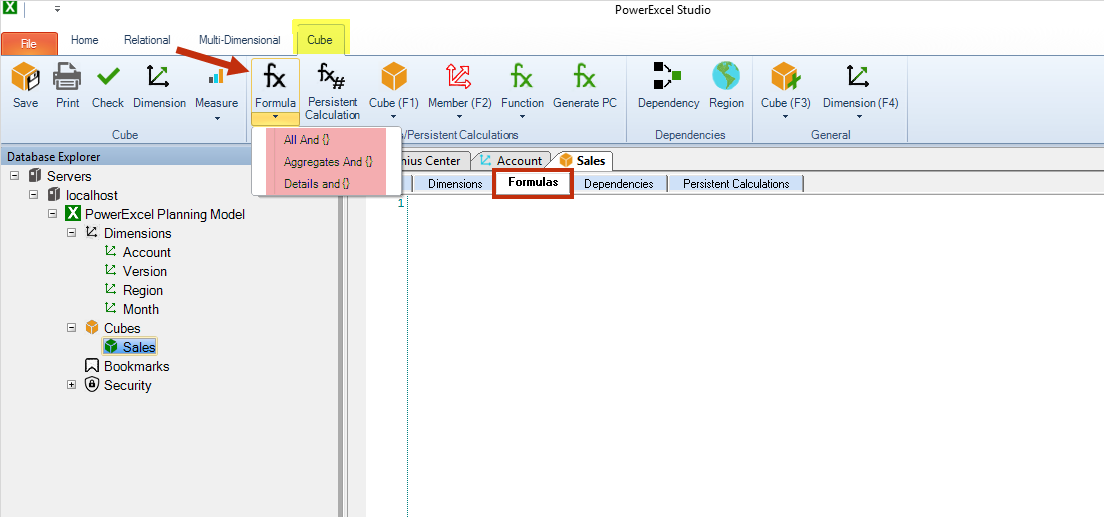
9. Click the Formula function icon (fx)(red arrow in the image above) found in the Cube ribbon (highlighted in yellow in the image above) to display the following drop-down selections (highlighted in pink in the image above):
These three selections govern how values calculate in the Cube. They constitute the Left-Hand Side (LHS) of the calculation, i.e., to the left of the Equals (=) sign, which are the defined intersection points to which calculated results are sent in the Cube.
10. Click to select the first selection, All and {}. Your cursor will automatically be placed between the brackets.
11. From the list of options that appear, double-click on Account, which will appear in red in the formula text.
12. Double-click on Gross Margin. This is where we want the calculation to go, as a result of the logic written into the Right-Hand Side (RHS) of the equation.
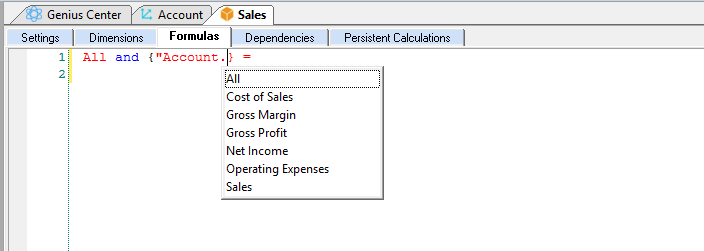
13. Add the rest of the formula into the Right-Hand Side, i.e., to the right of the Equals (=) sign, so that the formula statement looks as follows:
All and {"Account.Gross Margin"} = ["Account.Gross Profit"/"Account.Sales"]*100;
14. Close the formula statement with a semi-colon (;).
15. Check the formula statement if it is correct by clicking on the Check icon on the ribbon.
16. Right-click on the database (PowerExcel Planning Model) and select Save Database.
A discussion about Creating a PowerExcel Slice follows in a few pages. That said, for the present, it is worth showing an image of a simple PowerExcel Slice report from the Sales cube, including the Gross Margin calculation (highlighted in the image) created by the Cube Formula in Nexus Studio. The Members Actual and Canada (highlighted in the image) are dynamic, allowing selections across all Version and Region Members within the model. Furthermore, any selection of Members can be made in Rows (Account) and Columns (Month). Indeed, there are virtually limitless Slices that can be made from the model, all showing results dynamically calculated, including those done by the PowerExcel formula, in this case, Gross Margin.
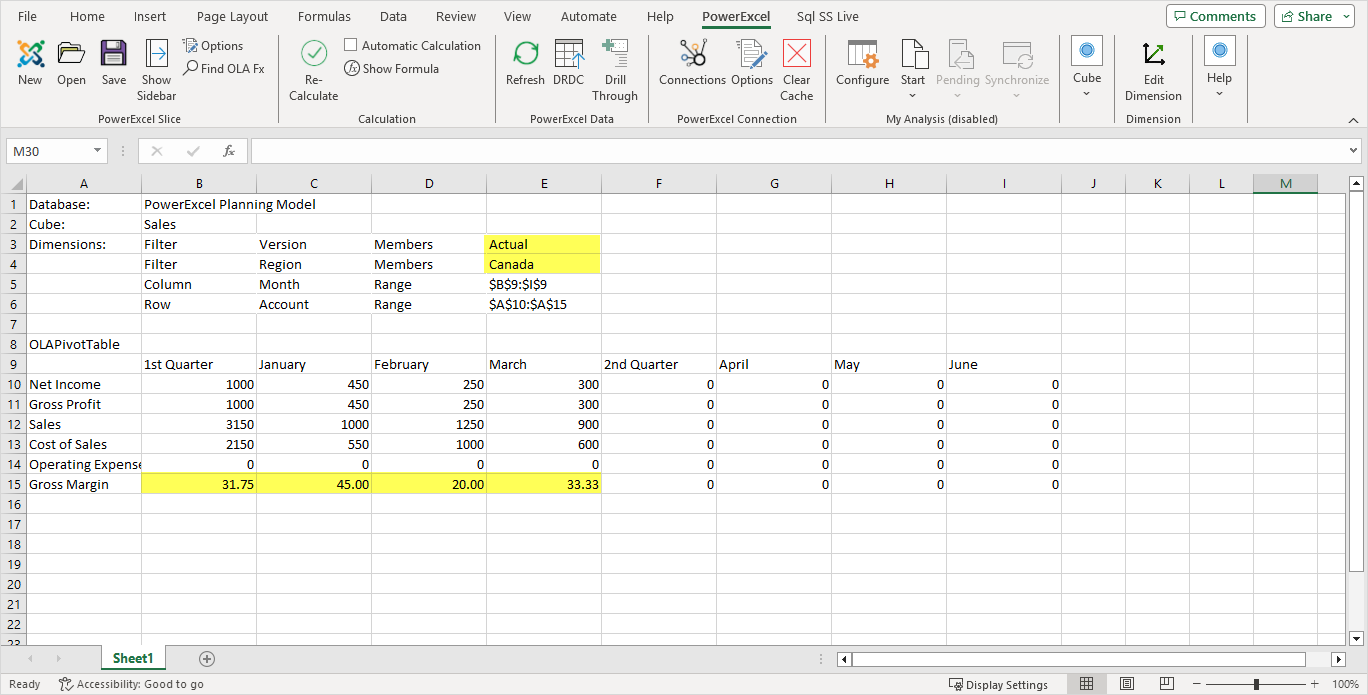
An example PowerExcel Slice (with figures already entered), showing the Gross Margin calculation