Entering Data for Planning (Budgeting, Forecasting) in a VIP sheets Slice
This section concerns the important topic of entering data into VIP sheets—essentially, populating a data model by entering numbers in a Slice.
Most often this kind of activity is done as part of a planning (budgeting, forecasting, etc.) exercise, and it includes multiple users working collaboratively on a shared Cloud-based model. With that in mind, the section immediately below demonstrates how to enter Forecast data simply by typing in numbers.
Typing Data into a VIP sheet Slice – Recalculation
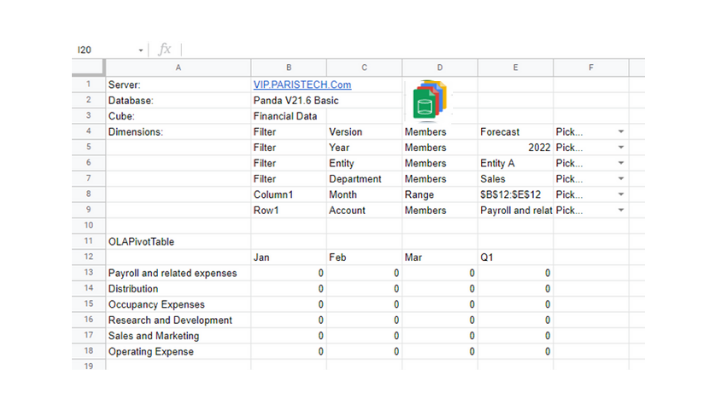
- Begin with a VIP Sheet like the one following. In this VIP sheet, figures may be entered at the Detail intersection points—the leaf (lowest) level of each Dimension. The Filter selections at this level are;
- Version: Forecast
- Year: 2022
- Entity: Entity A
- Department: Sales
Specifically, among the VIP sheets cells, numbers may be entered for the months Jan, Feb, Mar, where they intersect with the accounts Payroll and Related Expenses, Distribution, Occupancy Expenses, Research and Development, and Sales and Marketing. (Note that Q1 and Operating Expenses are hierarchies for those months and those accounts, respectively; numbers may not be entered on cells at their intersections.)
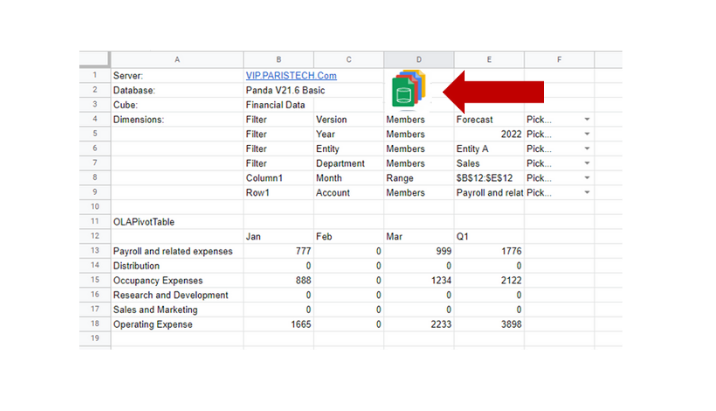
2. Once you have entered numbers in Detail cells, Click on the Recalc icon (see arrow in the next image). The figures will enter the VIP sheets model, and the hierarchy values—for Q1 and Operating Expenses—will be updated as well, as shown in the next image.
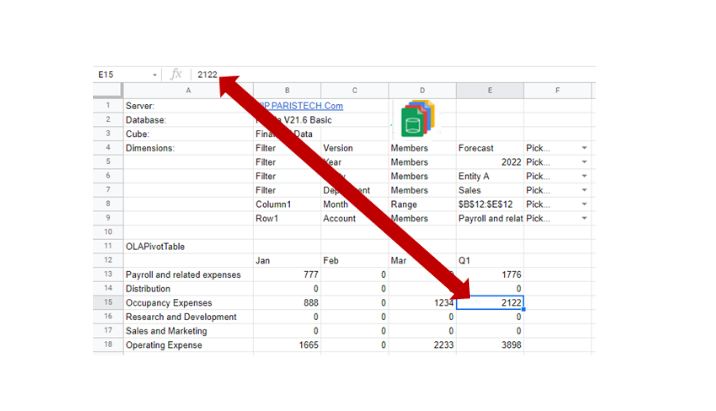
Note here that the figure in cell E15, 2122, shows, simply, as the number 2122 in the formula bar (see arrow below). This may seem unexpected because we might anticipate seeing a calculation of “=B15+D15”. This is not the case because the calculation is performed in the underlying cloud-based model (i.e., Jan, Feb, and Mar add up to Q1). Likewise, all hierarchical calculations (in this sheet, for Q1 as well as Operating Expenses) are calculated in the underlying model, thereby “taking the burden off” the VIP sheet, where, often, such calculations are mistyped or must be repeated for hierarchies like these. This is an example of the significant efficiencies inherent in the model to which the VIP sheet is dynamically connected.
Using VIP sheets in a Multi-User Scenario
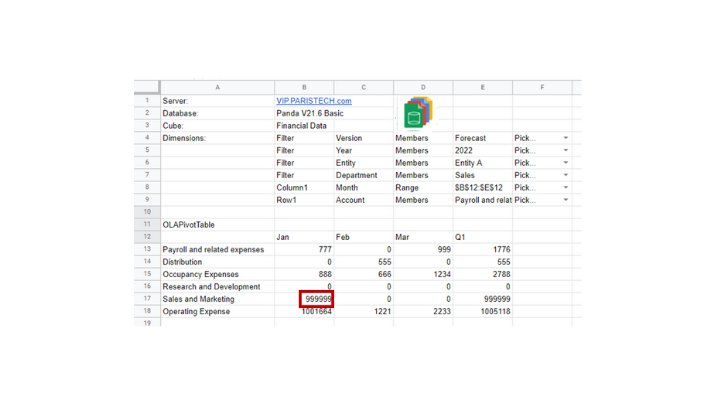
Because budgeting and forecasting—indeed all planning applications—are multi-user exercises, that involve several to many contributors, we want to show the effects of two users entering numbers. Let us therefore assume that it was “User 1” who entered the figures in the above example. Next, “User 2”, upon opening the same VIP sheet, will see those numbers in his/her sheet. When User 2 enters figures (below, 555 for Distribution in Feb, and 666 for Occupancy Expenses in Feb), User 1, upon Recalc, will see those figures, along with updated hierarchies, as below.
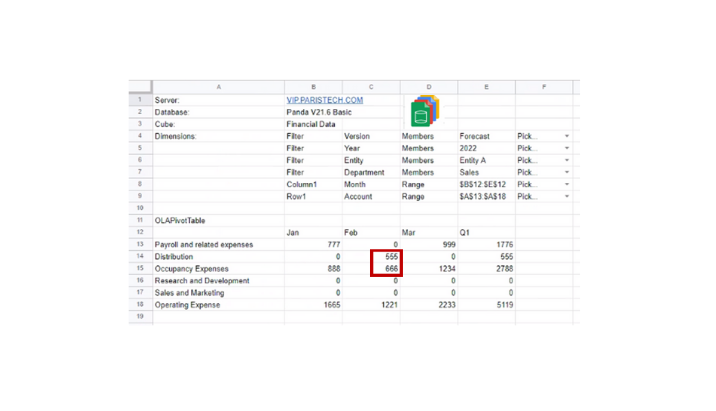
User 1 sees figures entered by User 2, along with calculated hierarchies
Likewise, when User 1 enters a figure (here, a “mistyped” 999999 in Jan for Sales and Marketing), User 2 will, upon Recalc, see the figure, along with calculated hierarchies.
VIP sheets have been optimized for these kinds of planning exercises, which are so critical to a company’s understanding of its performance and how it targets future success!
