
Gain valuable business insights from real-time dashboards.
Imagine getting real-time data on your management dashboards. Stop wasting time clerking spreadsheets, start analyzing and making better business decisions. Learn more about LeonardoUnderstand the state of your business at a glance.
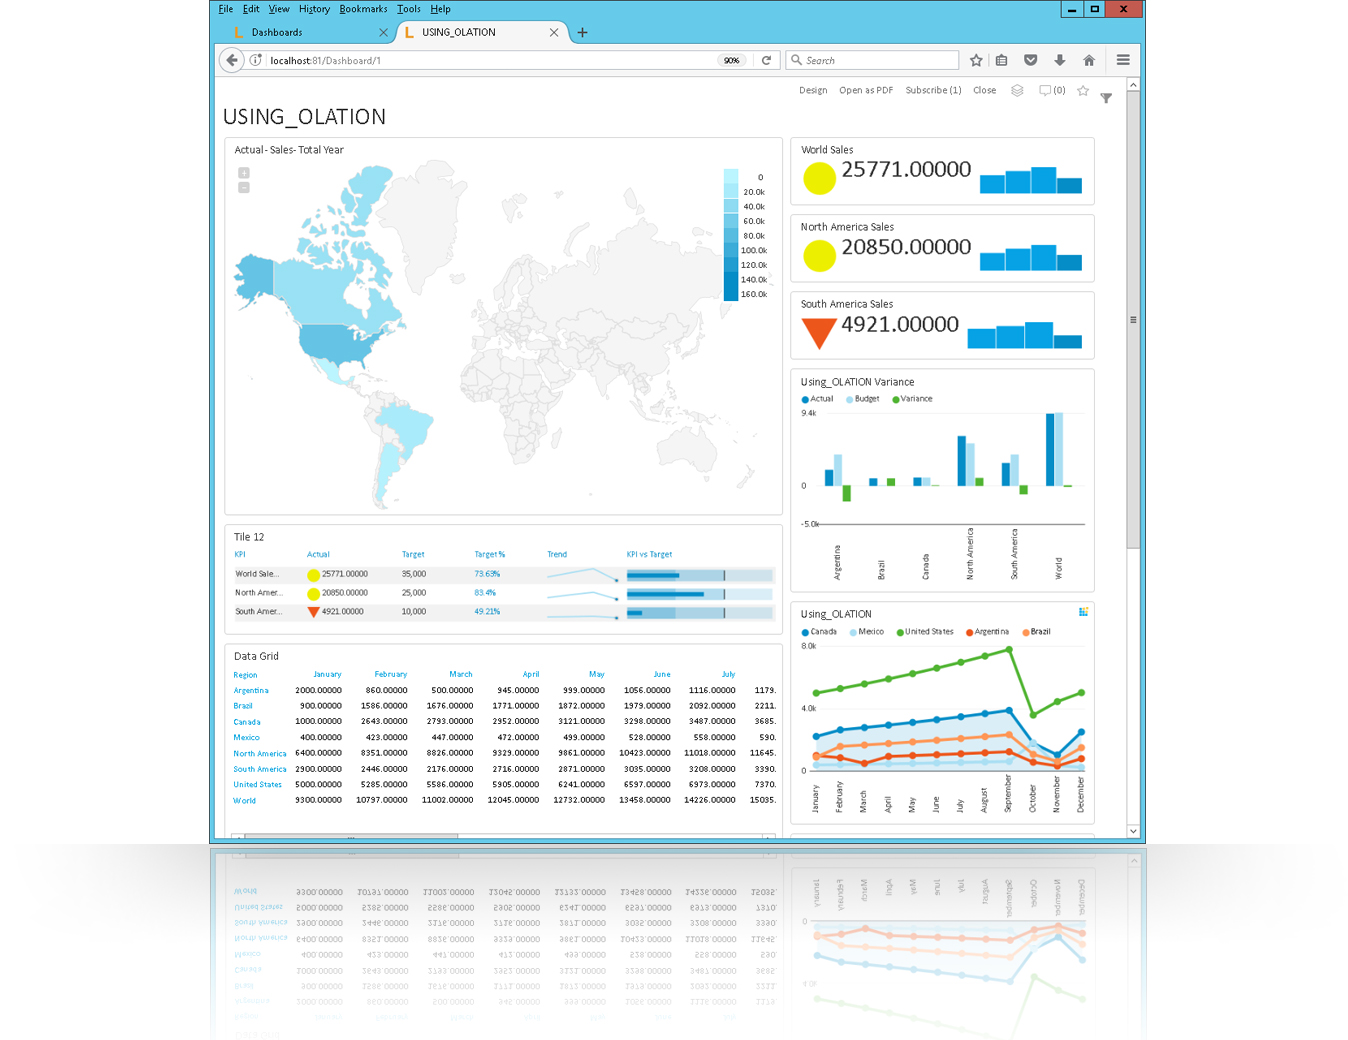
Leonardo, our visual analytics tool, is web based and has an easy to use drag and drop interface allowing users to create dashboards and KPIs on-demand.
Leonardo’s strength comes from leveraging on our OLAP technology to provide businesses the capability to use all available dimensions of your cubes as dimensions and filters to visualize the data at a glance in real-time dashboards.
Therefore, you can present your business data in the most meaningful and efficient way.
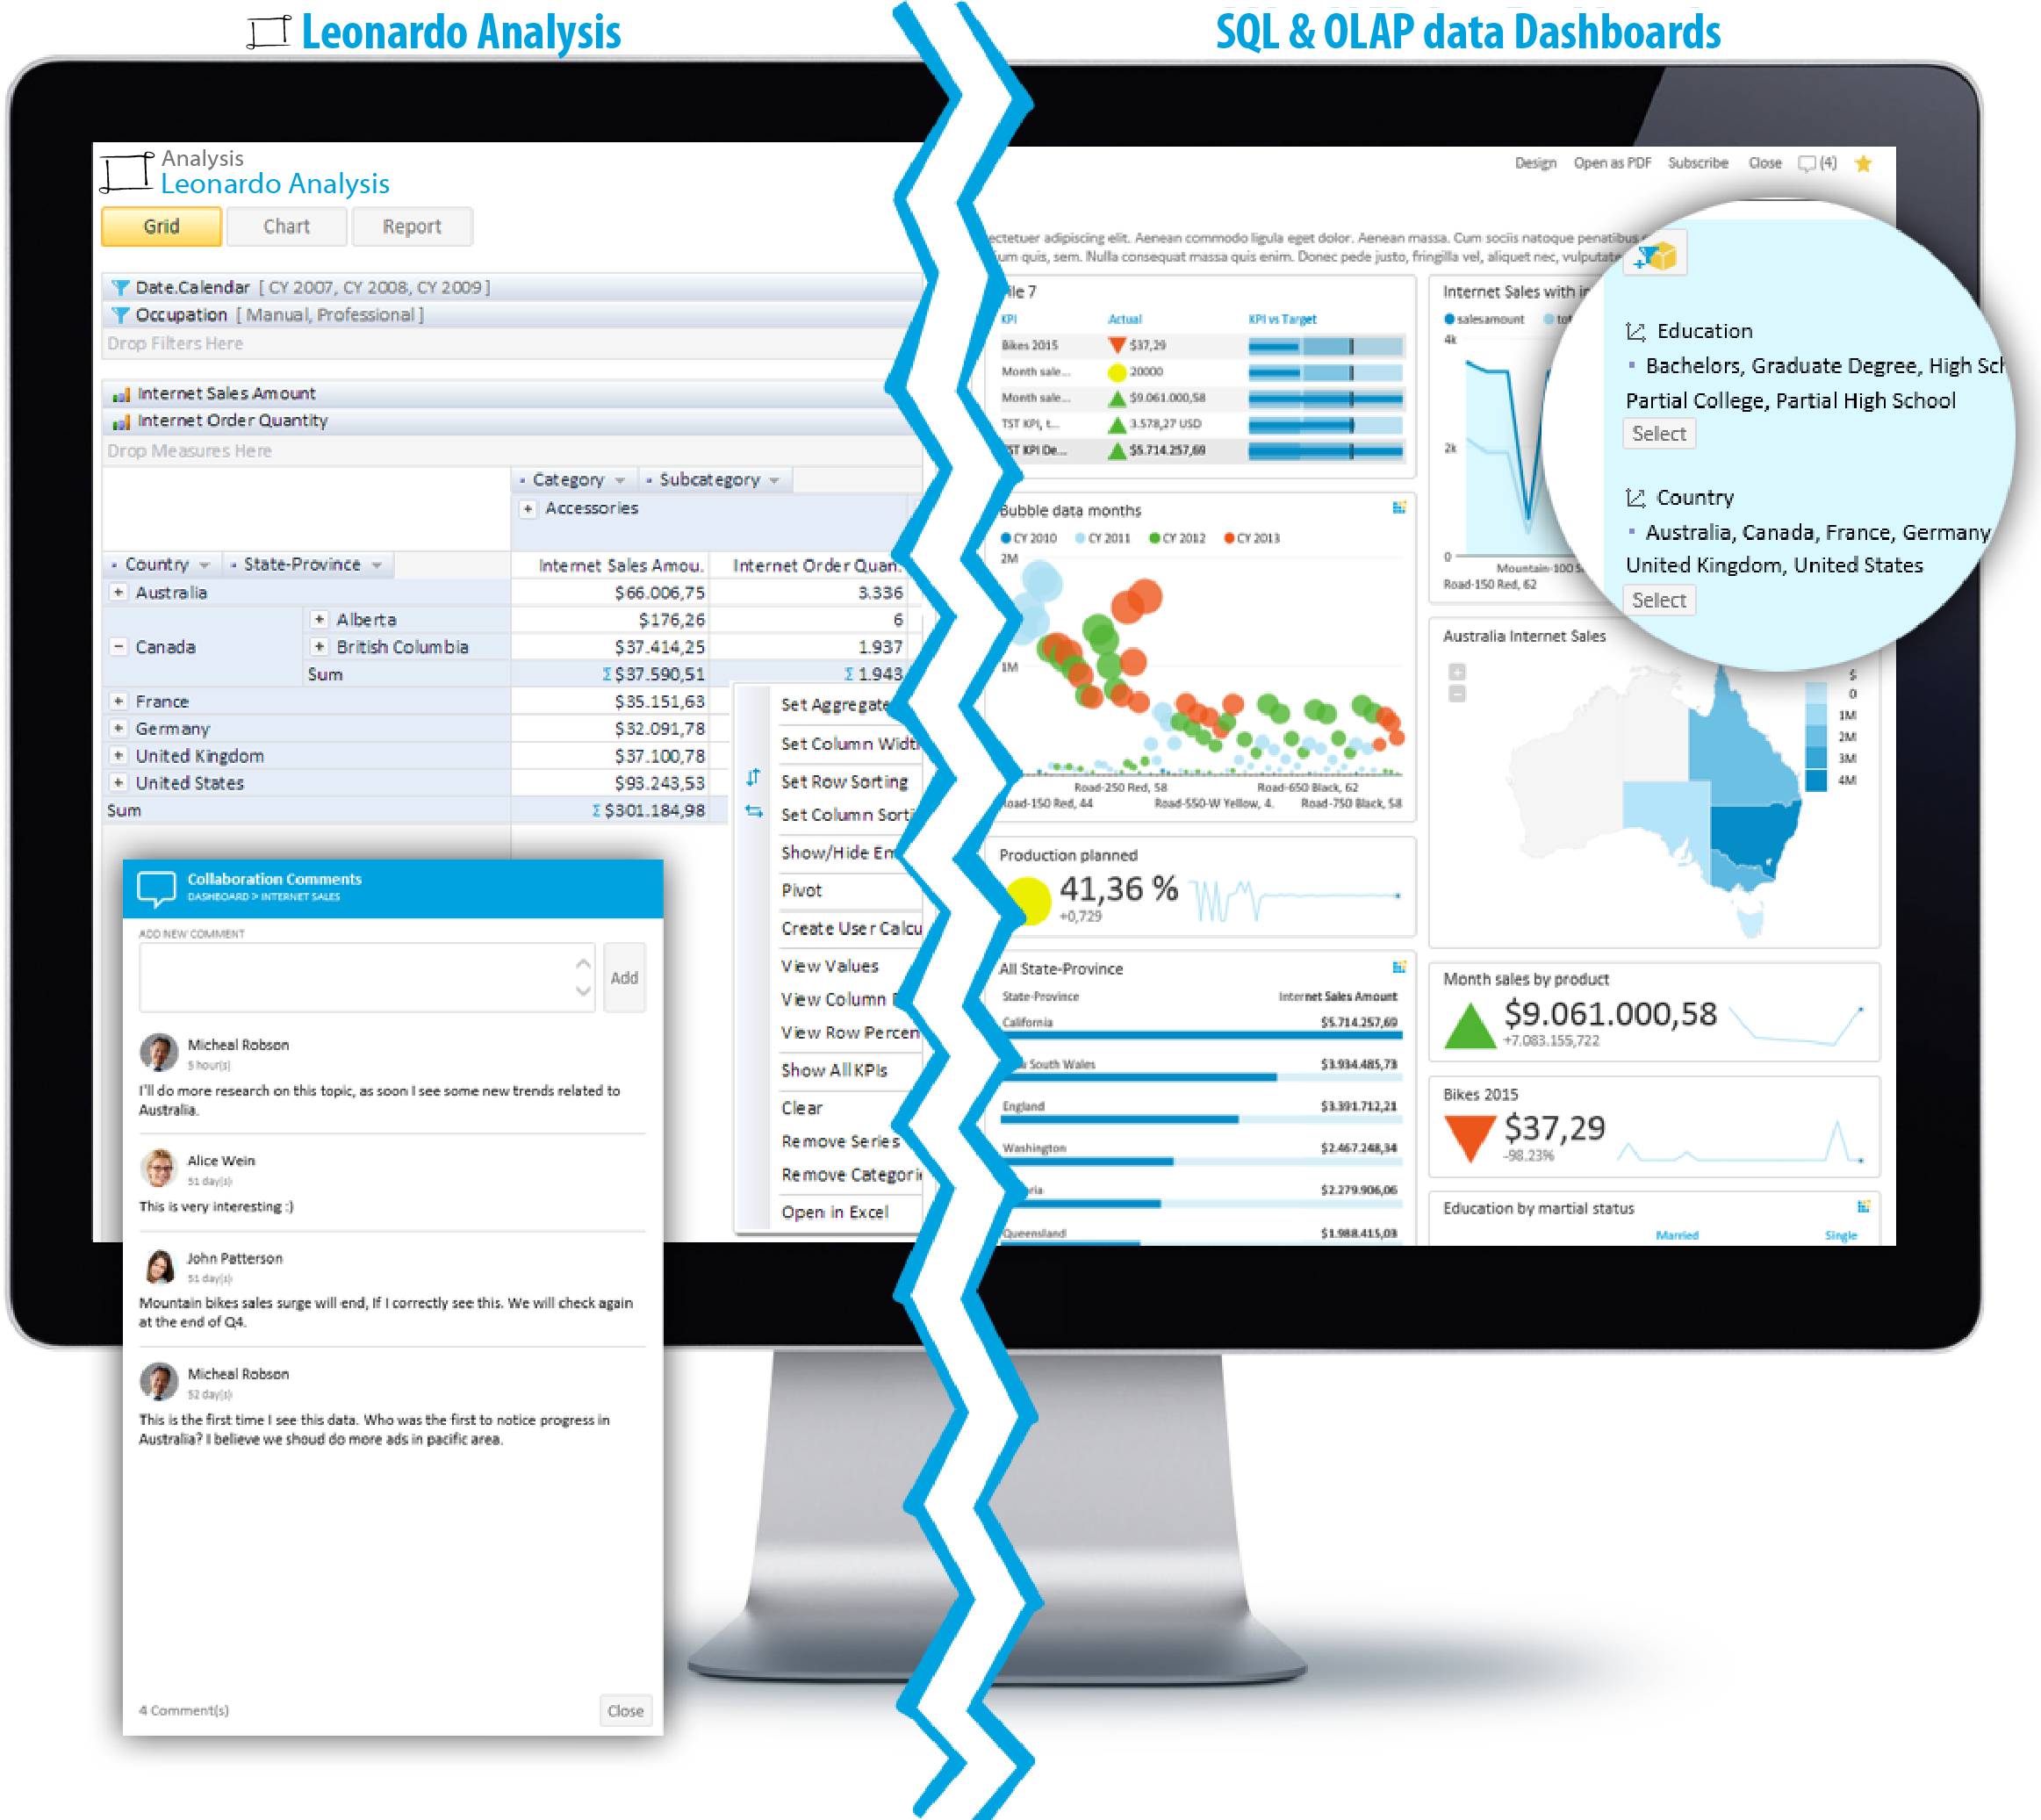
Update dashboards, databases, and Excel reports from a central database system.
Streamline versioning of reports and Excel spreadsheets across your company. Now, colleagues can collaborate efficiently by updating Excel reports in real-time with our OLAP technology running behind Leonardo to create accurate visual analytics.
Cloud-based Leonardo provides a view of the data sets used for each graph, chart, KPI or any kind of representation seen in the dashboard. To save time updating figures, users can update the data sets through the web-based reporting and these changes will reflect on their Excel reports in real-time. This helps solve the issue of versioning and promotes Excel collaboration among users wherever and whenever they are.
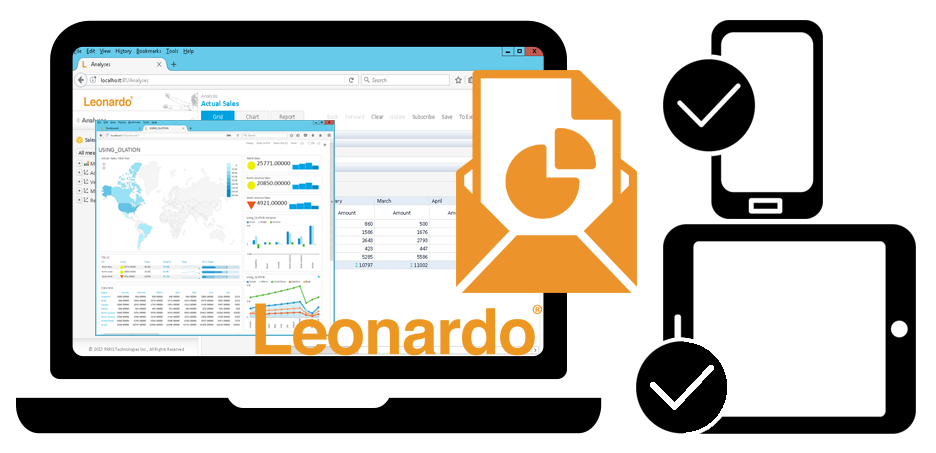
Don’t miss an update! Web-based reporting allows access from anywhere.
Users can access Leonardo from intranet or internet, depending on environment configuration.
Using any device – laptop, tablet, or mobile, users can easily access dashboards whenever they need them, through any browser.
Data visualizations along with its corresponding data sets can also be exported as Excel or PDF and then scheduled for sending via email.