To provide a bit of backgrounder, I’m a Marketing Manager for a software company that develops data modeling platforms for reporting, planning, and analytics. My job requires very different skills from those of our technical consultants and our typical customer—the Finance professional.
Understandably, despite my lack of technical and finance expertise, my job absolutely requires an understanding of our ideal customer. And if there’s one thing I’m sure about the Finance professional, it’s that they all use Microsoft Excel.
I am not a total noob in Excel. I learned to use spreadsheets in my previous job and was aware of how quickly they can get quite complex. I also like learning and using new technology from an end-user standpoint (that’s why I work in this industry). However, Finance professionals are next-level experts in Excel—spreadsheet ninjas, gurus, jedis, MVPs! So when our CEO announced that our entire sales and marketing team would be going through an Excel bootcamp, I approached the challenge with caution.
Days 1 and 2:
Building Financial Reports using Excel Data
On the first day of our Excel bootcamp, we were given a set of bulk data (resembling basic transactions) in Excel as well as several pages of printed financial reports: Income Statement by region, by product and by quarter, in various formats. We were asked to use the bulk data to re-create the reports however we liked in spreadsheets, so that they would look like the printed reports.
Ok, easy enough. The data structure was pretty basic, so I decided to use an Excel PivotTable. Just as I was feeling confident about my Excel skills, I ran into a problem.
Issue # 1: The bulk data given to us only contained single line items. So I needed to calculate results for Gross Profit, Total Operating Expenses, EBITDA, Net Income. How can I use formulas inside a PivotTable?
Solution: Thankfully, a quick Google search directed me to a guide on how to insert calculated items in a pivot table, and I was able to complete the exercise.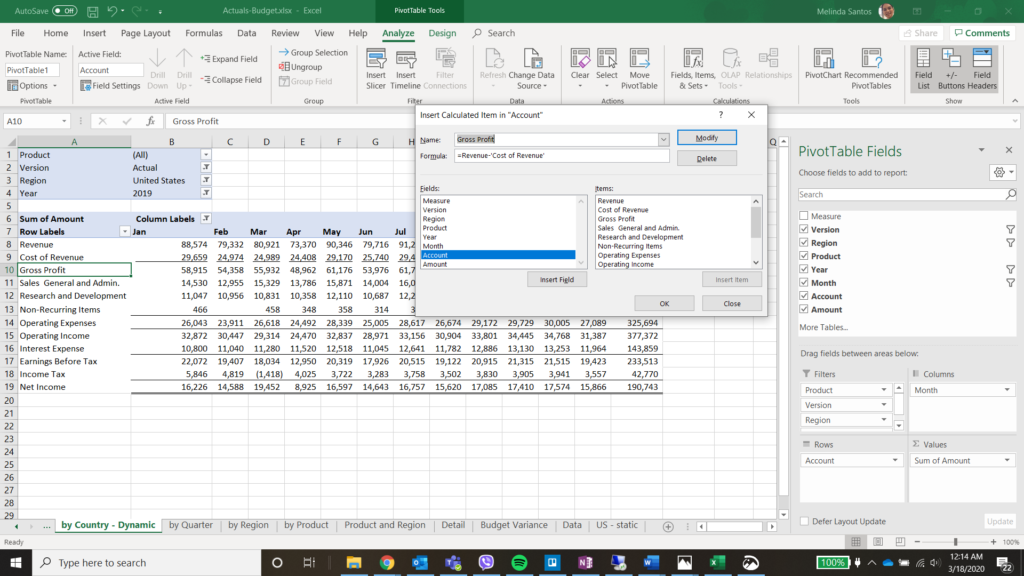
On Day 2 the instructor, picked by our CEO because of his spreadsheet expertise, helped colleagues who had more basic (if any) skills in Excel. (I actually was able to do some marketing work!) At the end of the day we went around the room to show how each of us completed the exercise. We each had our own method of building the report—with a PivotTable, or manually, or by using cell references, or by a combination of methods. It all depended our varying levels of knowledge in Excel.
Day 3: Introducing Budget Data
What seemed to be a recurring theme from Days 1 and 2 to the very end of the Excel bootcamp was our fluctuating understanding of Excel, along with our confidence about what we thought we already knew. And it seemed that with every Excel trick we learned, we were faced with another new challenge.
On Day 3, we were given a separate set of bulk figures: Budget data. The financial reports we did before were Actuals data, and now we had to create a report with current year Actuals and next year Budget data, side by side. Easy! Just combine the data sets and update the PivotTable, right?
Issue 2: Here’s the kicker: The data tables we were asked to work with, Actuals and Budget, were structured differently. I had to figure out a way to structure the Budget data the same way as the Actuals data before combining them. I certainly did not want to do it manually because it would take forever, and I might make manual errors.
Budget Data:

Actual Data:

Solution: Again, thanks to Google, I found this 5-minute YouTube tutorial on how to transpose tables using Power Query.

Once I had the Budget table in the correct structure, I was able to combine Actual and Budget data and update my PivotTables.
However, as I was creating a new report that would show Actuals and Budget data side by side, with variance calculation and % difference, I ran into mooore problems!
Issue 3: Filtering Year when Budget and Actuals are side by side.

Issue 4: Once you insert a calculated item (see issue #1) into your PivotTable you can no longer summarize your values by Average, Standard Deviation or Variances.

Issue 5: Calculated Items won’t work for multidimensional formulas.

Days 4 and 5: Succumbing to the manual way
I spent Day 4 trying to find a solution for the issues I faced, and unfortunately found none. (If anyone knows of a way to solve this problem that’s native to Excel, please share.) To be honest, I am quite surprised that I have already bumped into Excel’s limitations. Again, I was using a relatively basic set of data and was trying to build standard reports. Surely, Finance professionals would be dealing with far more complex data and reports!
I am also totally aware that it could also be human error—or, simply, lack of skill. Either way, on Day 5, I succumbed to building the report by combining a PivotTable with manual calculations using cell references. It was still somewhat dynamic but totally prone to manual errors.

At this point, I was ready to see the magic of our software, PowerExcel. This MUST be possible using PowerExcel…. To be continued. [Read Part 2: An Easier and Faster Way with PowerExcel]
As an Aside:
While I personally enjoyed the Excel bootcamp, not everyone shared my sentiments. In many ways, the experience of clerking spreadsheets was echoed by my colleagues’ complaints of on Day 1: “Why am I doing this? This is a waste of time. I could be spending my time booking calls and setting up meetings.” While Finance professionals are masters of Excel and would find our Excel bootcamp child’s play, it’s all relative. Finance professionals deal with a lot of reports, using extremely complex formulas and business rules, and wrestle with multiple large data sets that are structured differently, which they also need to regularly update. Finance professionals did not earn their degrees just to clerk spreadsheets day in and day out. “Why am I doing this? I should be analyzing data to maximize profitability, optimize efficiency…”
Overall, I learned a lot of cool new tricks in Excel and got some hands-on experience with our software. My two cents? Microsoft Excel might be enough for some companies, when a business is still small and simple. However, as things start to become more complex, organizations need to look for solutions that can lighten the burden in Excel and make the financial reporting, budgeting, planning, and forecasting process more streamlined, connected, and efficient.
 hbspt.cta.load(388112, ‘479b1567-d778-4b6d-a517-6b1bc8f56d55’, {});