Read Part 1: Our CEO made us build financial reports in Excel to understand our customer’s pain. Here’s what I learned.
After going through our CEO’s Excel bootcamp, I learned a lot of Excel tricks that helped me resolve most of the issues I encountered in building spreadsheet reports. And I would assume that 90% percent of the issues that normal Excel users encounter can be solved natively with a little bit of research and know-how.
But how hard would it be? How much time would it take? Knowing what I know about our customers, working on spreadsheets is a part of their daily grind. Reporting, planning, and forecasting don’t end after they create their Excel-only applications; rather it is just the beginning.
So I wonder, how much time do Finance professionals really spend analyzing their workbooks compared to the time they spend updating, consolidating, and error checking them? Much as I try to step out of my marketing shoes, I truly believe that this the utmost benefit that our product PowerExcel provides: Productivity.
By doing the same exercise that we did during our Excel bootcamp, I was able to compare how exactly PowerExcel makes financial reporting, planning, and forecasting faster and easier. It also provides some insight on how PowerExcel improves productivity as it becomes part of their planning and forecasting process.
Exercise 1: Building a basic P&L report with Actuals data
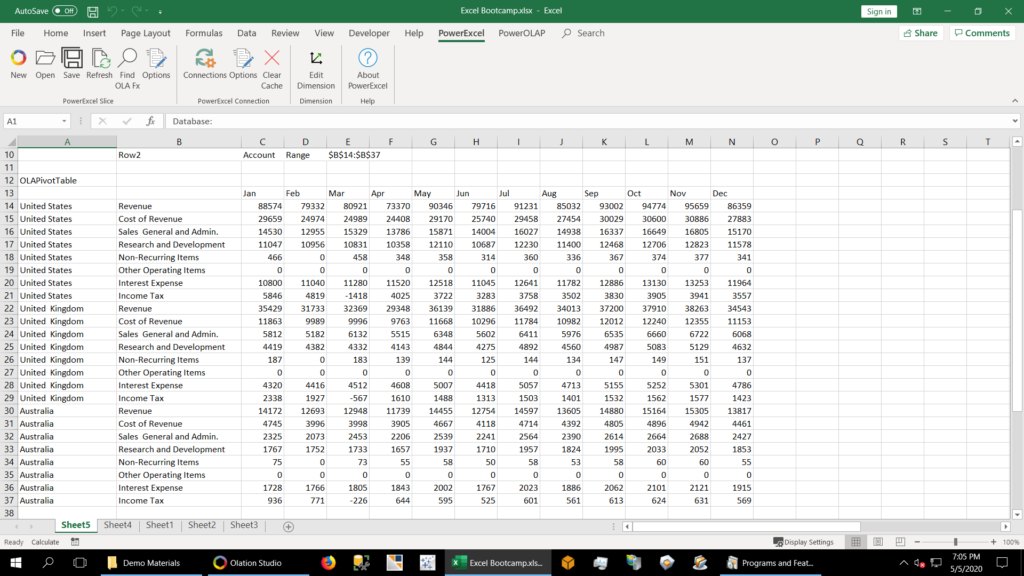
Recap: The dataset did not have calculated values like Gross Profit, Total Operating Expenses, EBITDA, and Net Income.
Using native Excel functions: I built the basic P&L using an Excel PivotTable. I inserted calculated Items for the missing accounts, which are formulas within a PivotTable.
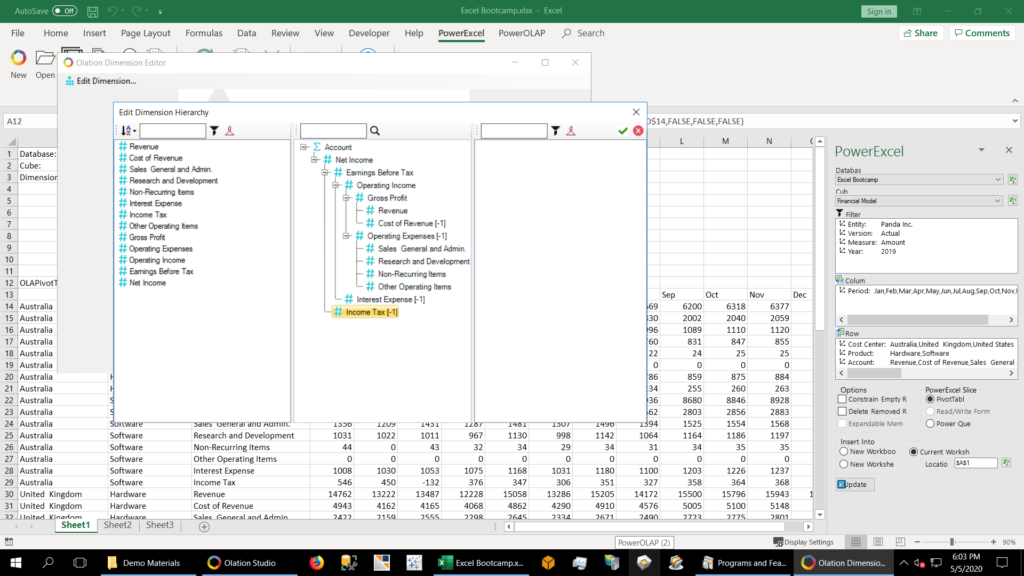
Using PowerExcel: I defined how the accounts should roll up using PowerExcel’s Dimension Editor. This hierarchy will now be applied to ALL reports moving forward.
Because PowerExcel connects to a shared model, the roll-ups/hierarchy that I defined will be available to my colleagues who are using the same model to build their own reports. This is in stark contrast to a single person managing an ever-expanding spreadsheet system, which can only be shared via emails (and those spreadsheets do tend to proliferate and change with each recipient!) or on a shared drive, where it still has to be managed and it continues to grow.
In PowerExcel’s Dimension Editor, I simply added new members for calculated accounts such as Gross Profit, Operating Expenses, Operating Income, Earnings Before Tax, and Net Income. Then I dragged and dropped the existing accounts according to how I want them to roll up. I added a negative one (-1) weight to accounts that are meant to be subtracted.
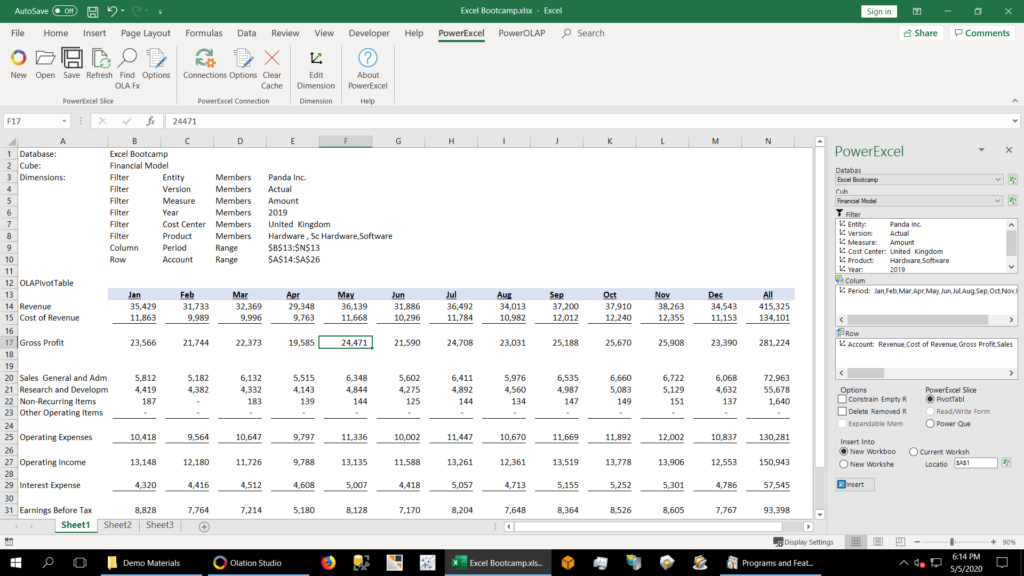
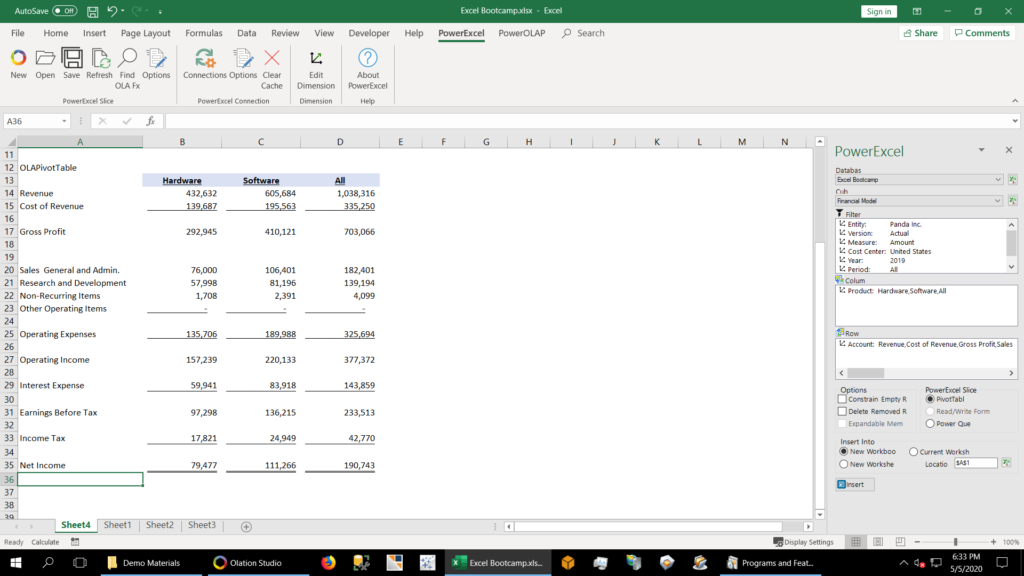
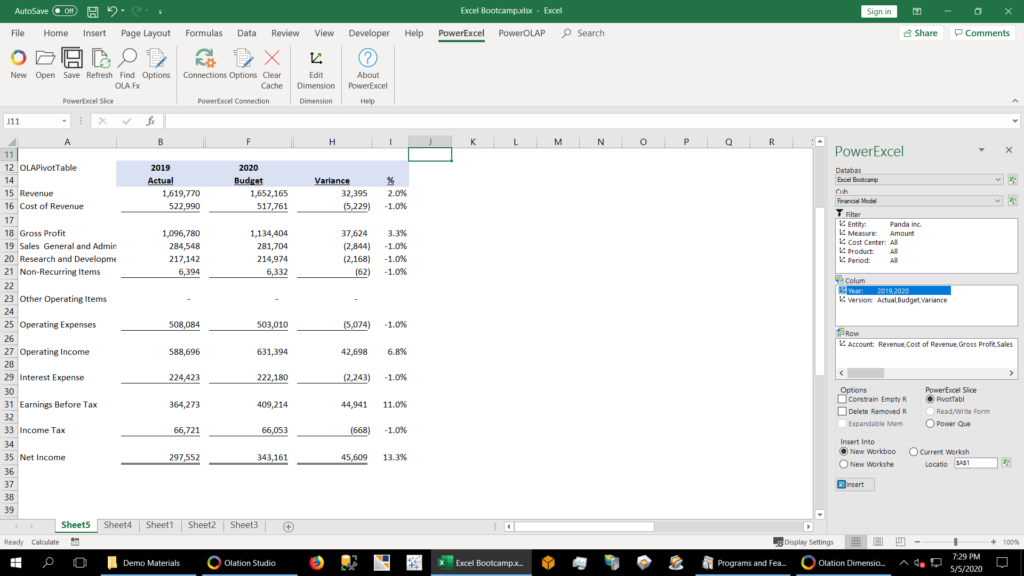
On the spreadsheet, I selected the filters, rows, and columns that were used on the report and then formatted my spreadsheet using native Excel functions. PowerExcel provides so much more freedom in formatting compared to an Excel PivotTable. I was able to add spaces between rows (and columns, if need be), and format each cell however I wanted.
Creating similar reports just meant moving around columns, rows, and selecting the correct filters. The box shown at right shows just how much PowerExcel looks and works like a PivotTable—you could even think of it as PivotTable+, with that “+” meaning all the things you would like to do in a regular spreadsheet, but cannot in a PivotTable.
Verdict: While both are PivotTables and PowerExcel are quick and easy to work with, calculated items are unique to each PivotTable. A quick workaround would be to copy the PivotTable instead of making a new PivotTable for each new report. With PowerExcel, defining roll-ups/hierarchy is done once and is applied to all subsequent reports built from the model.
Exercise 2: Introducing Budget Data, Variance Calculation
Recap: We needed to make a P&L comparing last year Actuals and this year’s Budget, together with the Variance and Variance %. The Budget data that was provided had a different structure from the Actuals data.
Using native Excel functions: Though it took me a while, I eventually learned that I could use Excel’s PowerQuery to pivot the Budget data to the same structure as the Actuals data.
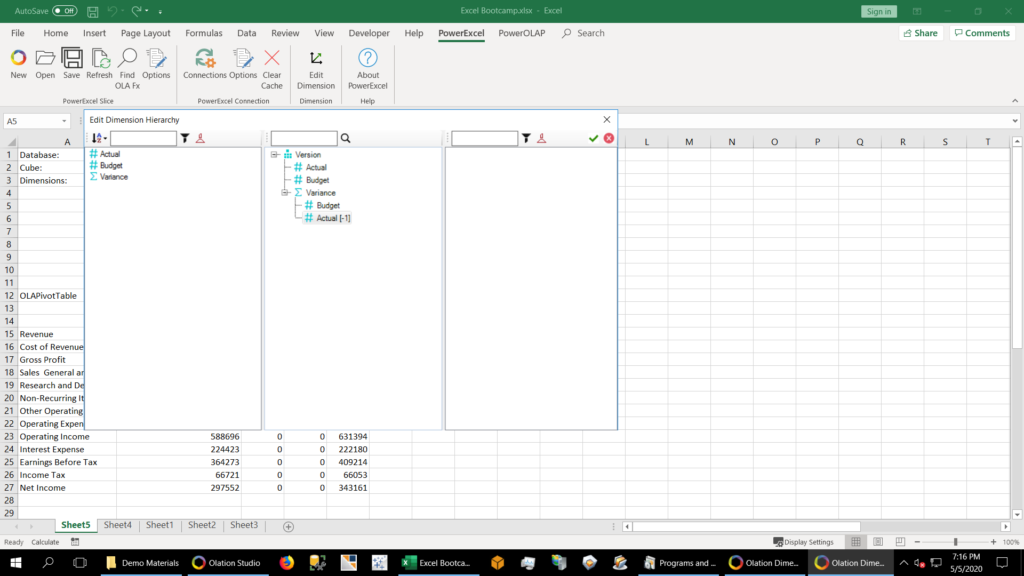
Using PowerExcel: I used PowerExcel’s Dimension Editor again to edit the Version dimension. I added a member for Budget and another member for Variance which is calculated by subtracting Actuals from Budget. This is as simple as defining the roll-ups.
After adding the Budget and Variance version, I created a budget report which initially had no data inside. I then copy-pasted the budget data into the spreadsheet and hit F9/Refresh to save the data into the model. The data that I added was immediately saved in the shared model and is immediately available to my colleagues who are using the same model.
I then created the Actual vs Budget report as usual – by dragging and dropping the dimensions to the columns and rows and selecting the filters.
Note: I added the Percent calculation manually using native Excel functions. Though formulas can be created in PowerExcel, it would require cube calculations which is out of my league, but something that our consultants can do quickly.
Summary:
While these exercises are pretty simple compared to real financial reports that organizations create, it provides a peek into how PowerExcel can give Excel users the extra power that they have always needed from their spreadsheets.
To summarize, here are the top 3 advantages of PowerExcel:
1. Dimension Editor
a. For setting-up roll-ups/hierarchies (e.g., for Accounts)
Having the capability to define hierarchies and automate roll-ups takes a major burden off Excel because it eliminates all the SUM and SUMIF functions that proliferate like crazy in workbooks.
b. For creating versions of your plans and forecasts
Creating a new version of your data provides a location for your plans and forecasts to reside in the model, for all to reach—a truly collaborative model. Organizations that want to reforecast their data across multiple scenarios can easily have multiple versions of their forecast.
2. Freedom in formatting
Financial reporting is storytelling and formatting has a huge impact on how the story is told. Excel gives users a lot of flexibility in formatting, and PowerExcel does not take away any of it. Formatting is not even a PowerExcel feature; rather, it aligns with our concept of leveraging the best features of Excel. PivotTables and spreadsheet-like web interfaces fall short in producing reports that are formatted according to how shareholders and other stakeholders want to see them.
3. Shared Model
a. Working from a shared model really elevates all the features that PowerExcel has to offer.
In these examples, we’ve seen how setting up roll-ups and adding budget data can be done. More than that, working from a shared model means that, for example, hierarchies only need to be defined once, and they become instantly available to other users of the model. As such, everyone has access to and can work from the same version of plans and forecasts.
b. Having a shared model is also what improves user productivity. Imagine working on a version of your forecast from remote locations and being able to see, instantly, forecast numbers entered by your staff or (if it makes sense from the point of view of security) colleagues around the world. There is no need to email your workbooks, no time wasted in waiting and consolidating workbooks.
c. Working from a shared model means that a change in one data point automates a recalculation of all connected reports. Therefore, all your reports are ALWAYS up to date with the latest numbers.

