Guest blog: this post by PARIS’s Asia partner Trinity Bridge—a “Specialist advisor and execution partner for businesses on a growth path in Asia”—speaks to “the pain of forecasting and how to end it.” Trinity Bridge conducted a survey of CFOs in Hong King and Singapore, asking about Forecasting Frequency; Multiple Scenarios; Involvement from the Business, and; Software Tools. The posting’s author, David Newton, has been CFO of several large Hong Kong – based media concerns. Through those years he has benefitted from, and become an expert consultant in, Planning, Analytics and Reporting solutions based on PARIS Technologies products.
It’s a common misconception that, for corporates, forecasting is a relatively straightforward task that is handled by the finance department. As our Q4 survey of CFOs in Hong Kong and Singapore shows, forecasting is rarely straightforward, and it usually drags in key people in the wider organisation. This particularly matters now because one significant impact of the coronavirus is increased business volatility and hence the need to update risk models and forecasts more frequently than before. This is compounded by poor processes and a failure to use suitable software, resulting in a world of pain.
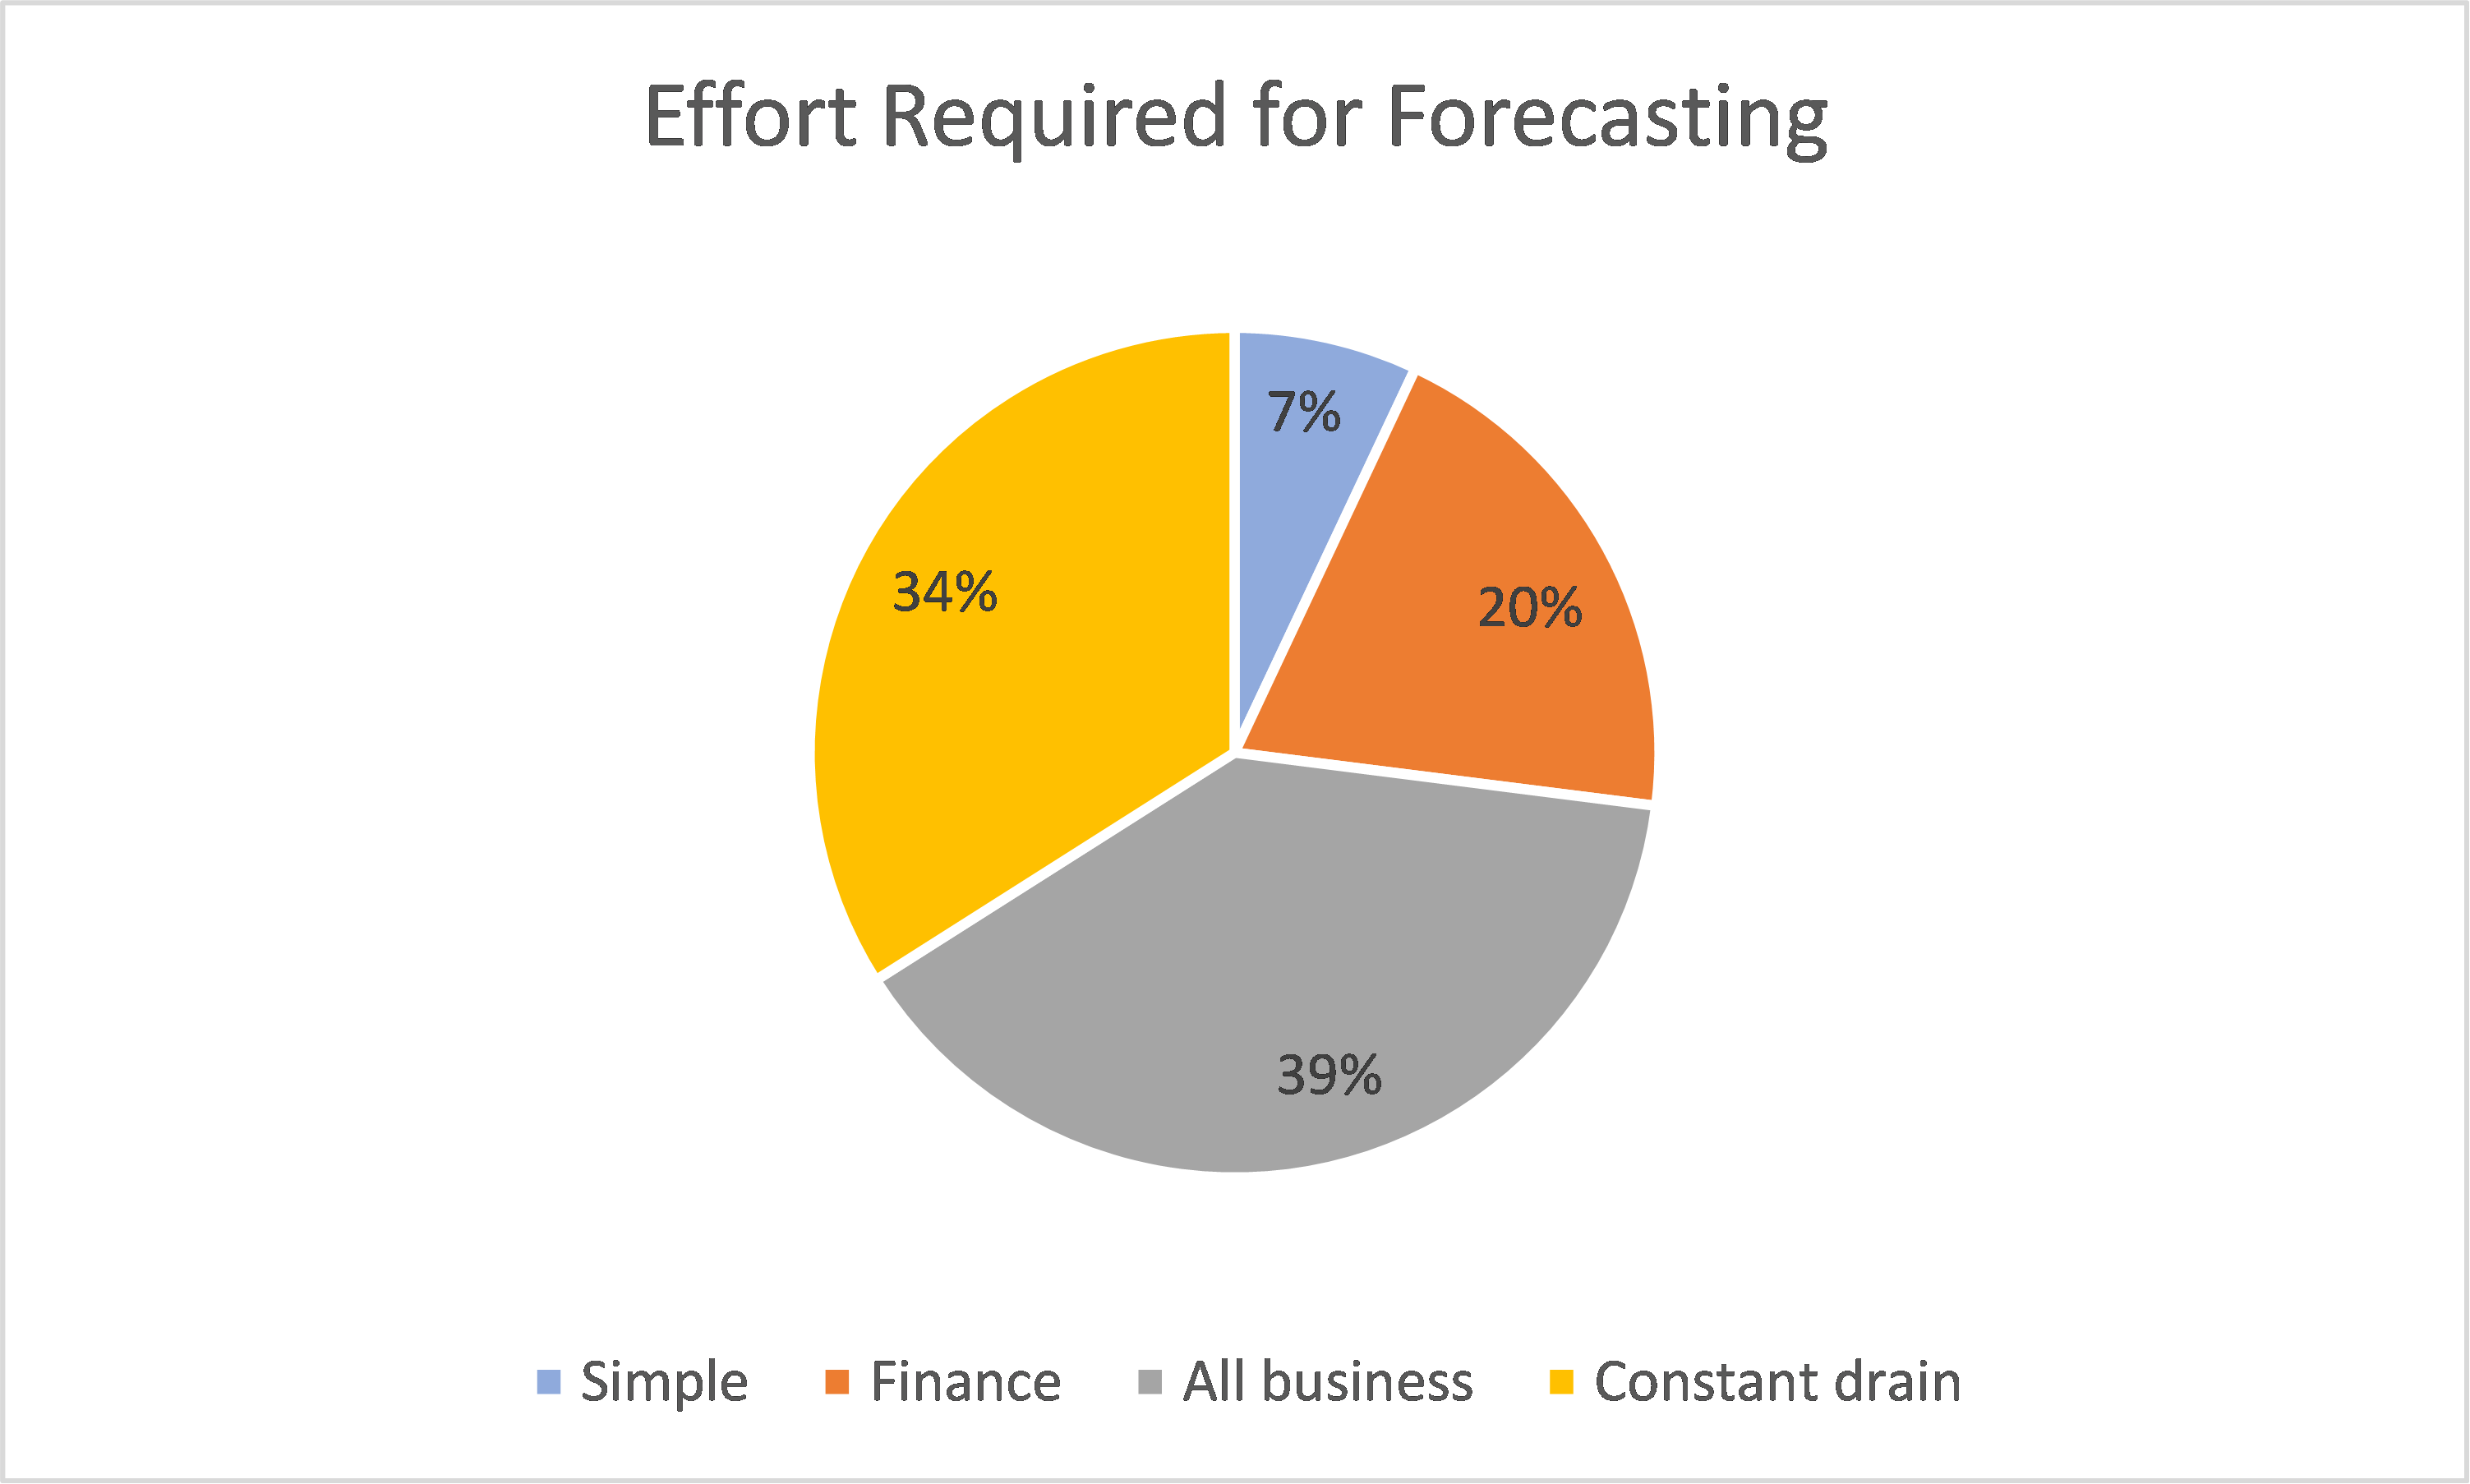
For 73% of organisations forecasting is either a major task involving the finance function and department heads, or it is a constant drain on the whole business. This is not good. Whilst forecasting helps businesses plan for the immediate future, the business front line needs to devote its resources to getting business done and ought not to be bogged down in the forecasting process to this extent.
We looked at 4 important elements of the forecasting process to diagnosis the problem: Frequency, Scenarios, Involvement from the Business, and Software Tools.
1.Frequency:

Firstly, in the subset of companies who find forecasting to be a “constant drain on the whole business”, 48% of those businesses are forecasting at least weekly, with 17% required to forecast on an ad hoc frequency.
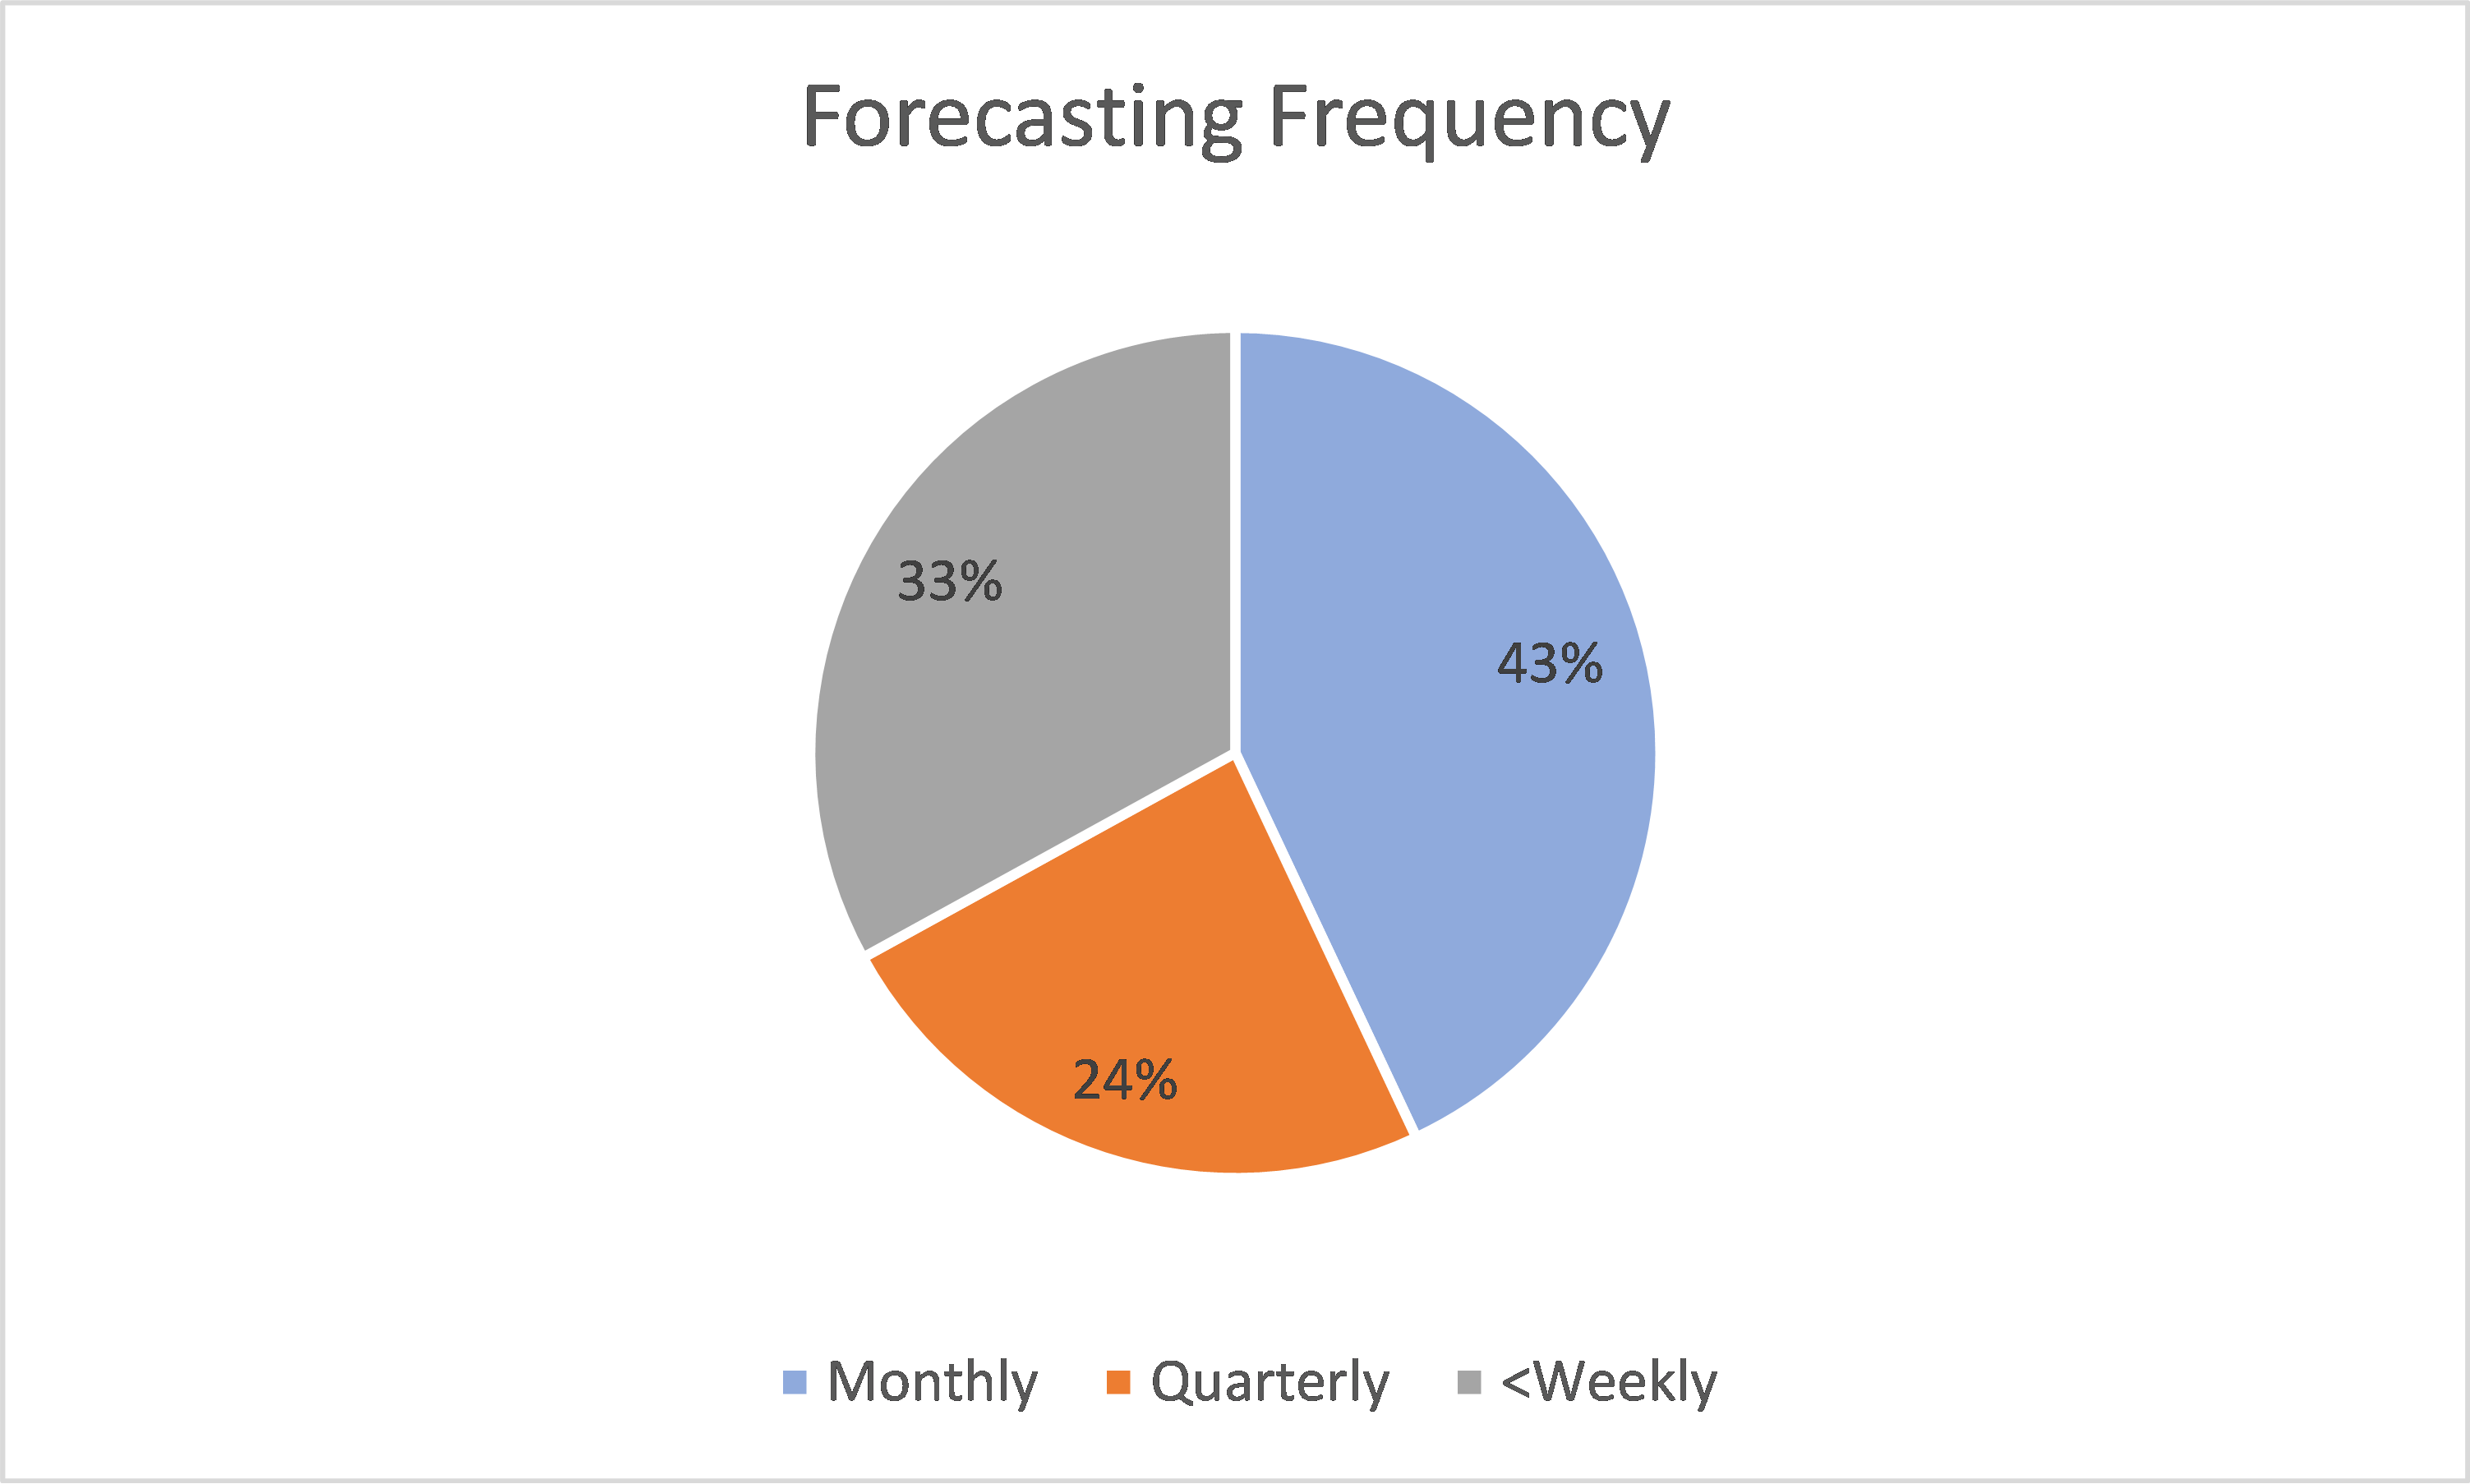
And the uncertainty of business in a pandemic is causing an increase in forecasting frequency. 73% are putting more demands on the finance function, with 43% of companies now forecasting more often and a further 30% saying that forecasting is now ‘on demand’. So it seems the pain of forecasting is only getting worse.
2. Scenarios:
61% of companies run multiple scenarios when they forecast and, amongst those who find forecasting to be a constant drain on the whole business, 74% are running multiple scenarios.
3. Involvement from the Business

So, the problem is compounding: forecasting is often required at least weekly, with the involvement of not only the finance function but also key managers across the entire business, and; the majority of businesses are asking for multiple scenarios. Surely, to cope with this perfect storm of requirements, businesses must be running smart processes with the best software tools?
- Software Tools
Unfortunately, this is not true. Only 10% of businesses are using specialist software to support what is clearly a complex business activity. 90% of business are using only Excel, which is neither collaborative nor a multi-dimensional modelling tool, and so cannot reasonably be expected to support multiple scenarios of a complex business model across a distributed network of finance executives and business managers.
Much is spoken about the digital transformation of the finance function, and great strides have been made in the area of transactional processing. However, forecasting, budgeting and planning have largely been left out of this much needed reform.
The Pain Index
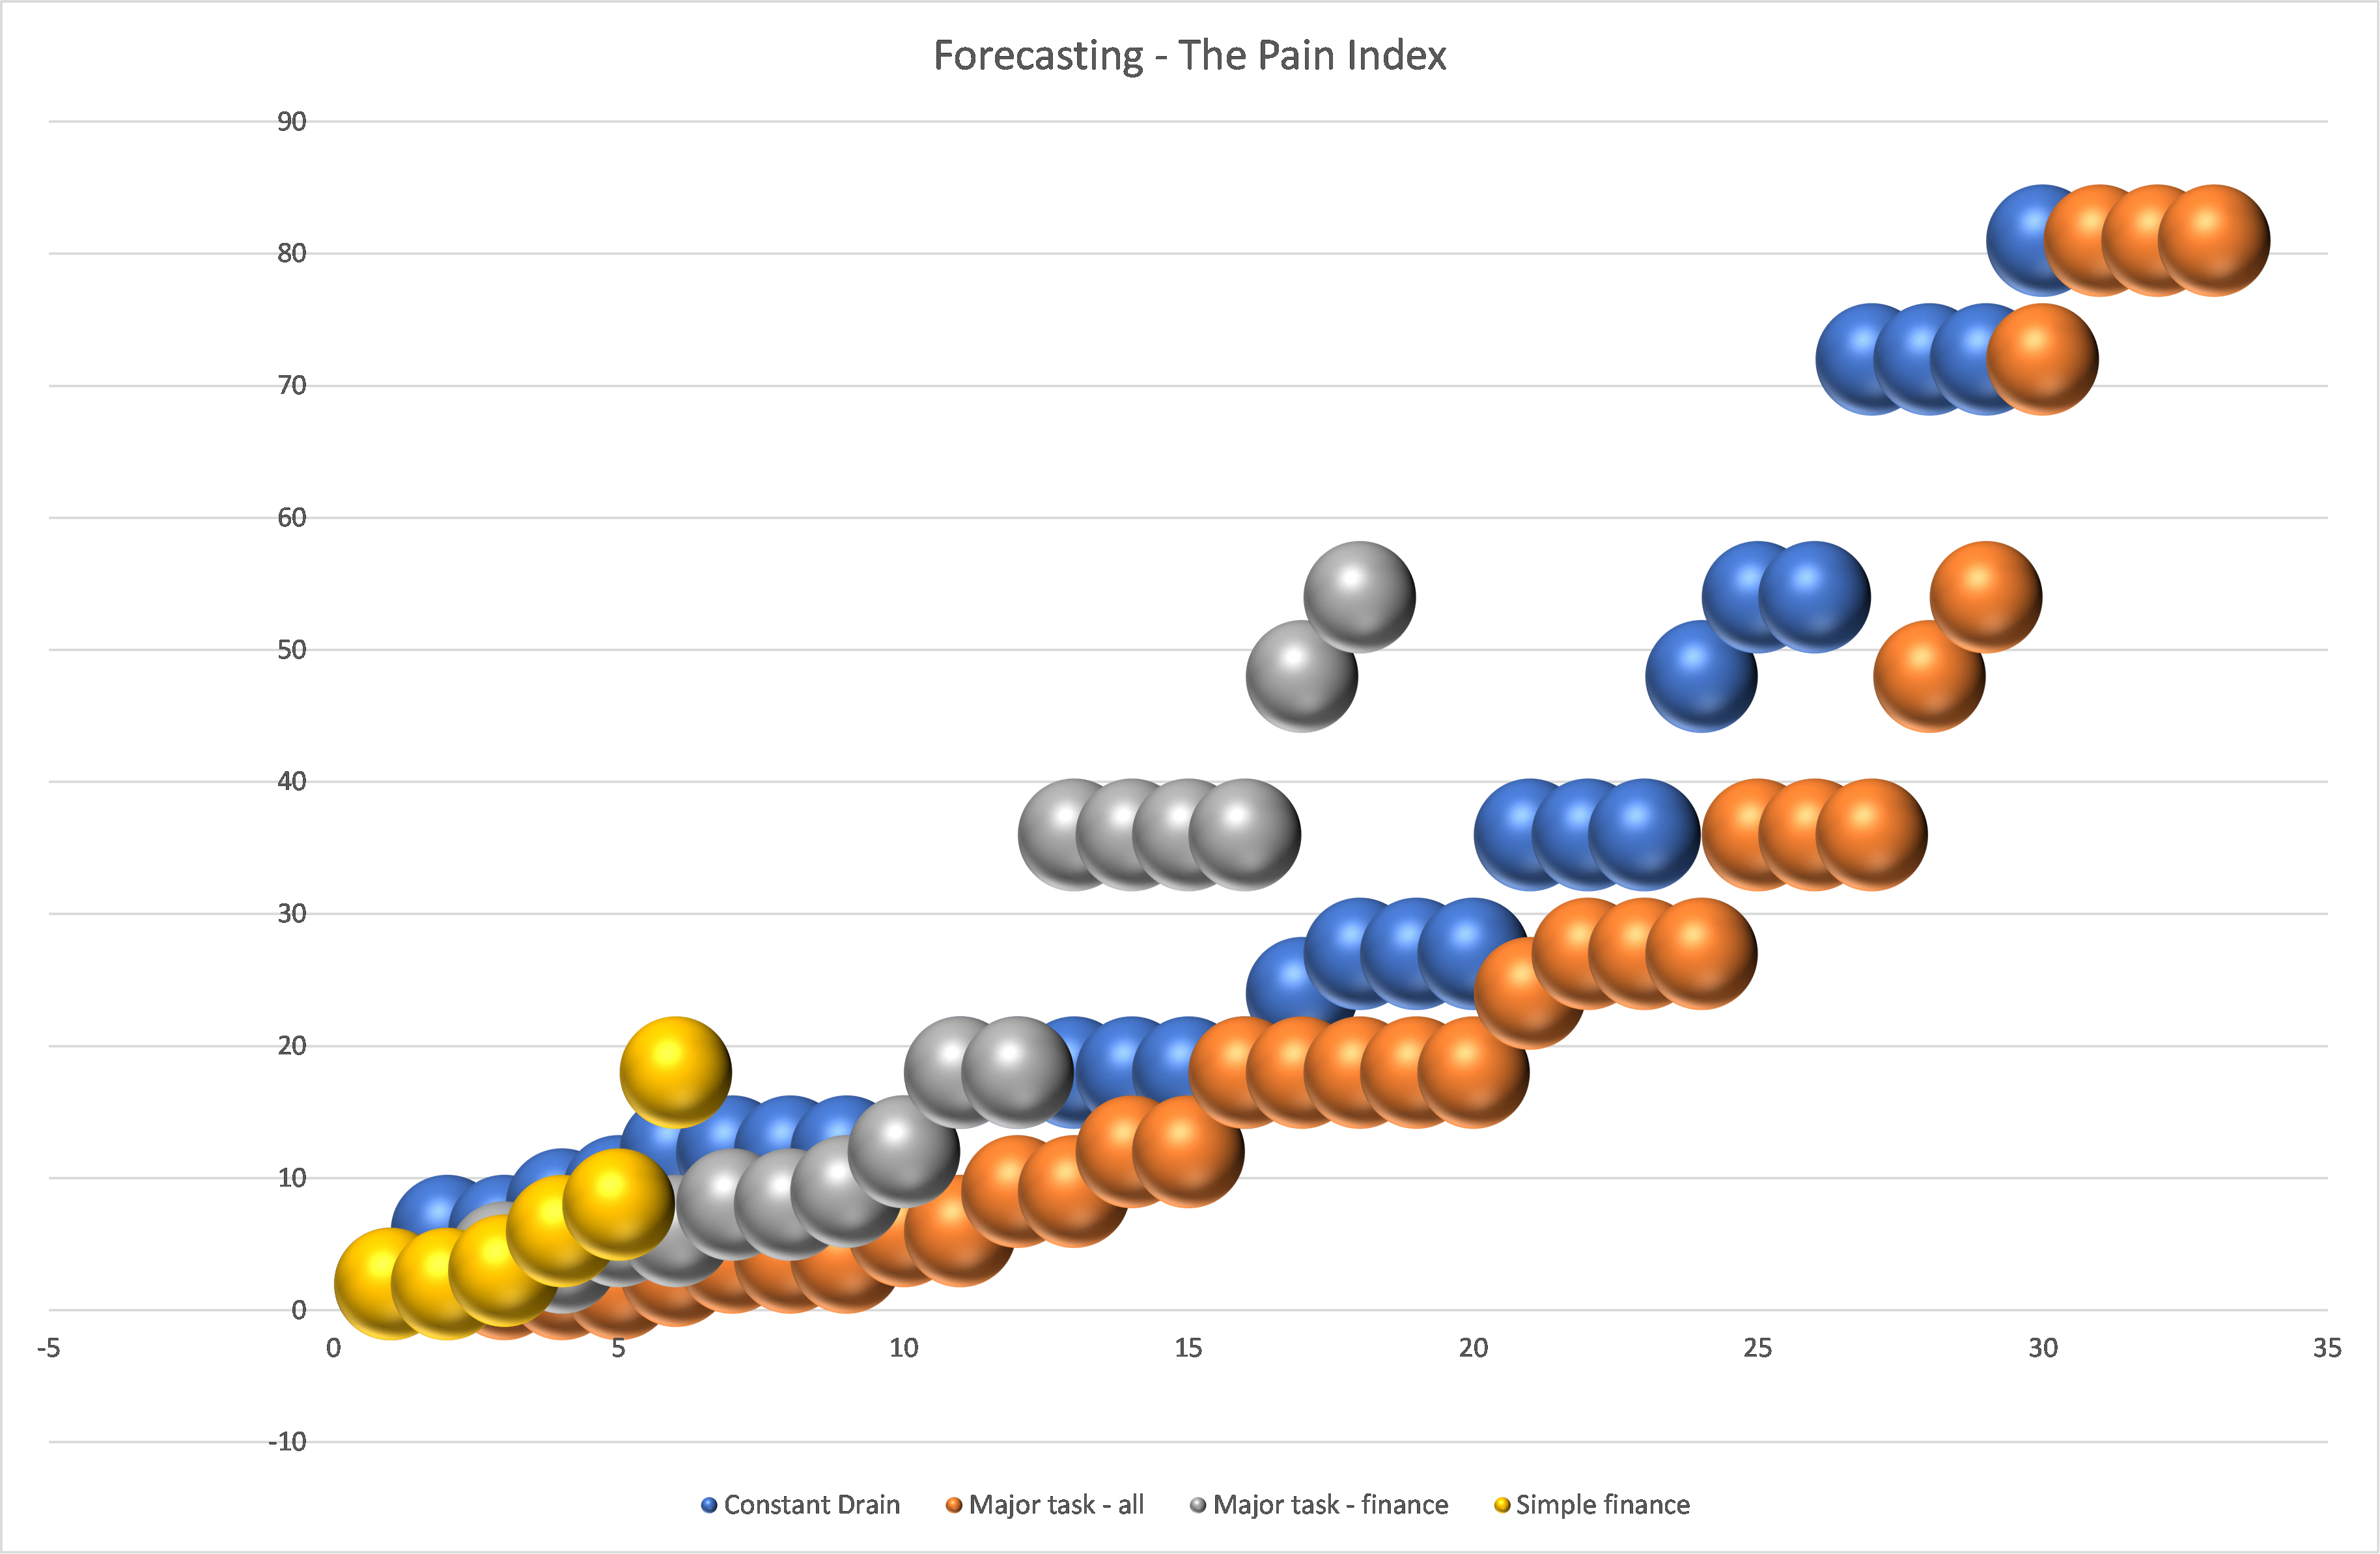
The corollary of this analysis is that many companies struggle badly with forecasting as the four factors described have a compounding impact on the overall process. By combining them we can create a ‘Pain Index’, shown below, which correlates to the sentiments expressed in the survey.

Tips on how to take the pain out of forecasting
- Don’t use Excel for things it is not designed for. It is not a database, nor is it collaborative or fit for the kind of multi-dimensional modeling required in a detailed business forecast
- Do use a multi-dimensional database, which links to your ERP system for inputs, and links to Excel or Power BI for dashboards, or links to another graphical interface of your choice. It is all very affordable these days.
- Re-engineer the forecasting process. Give non-finance managers output dashboards they will use. Customize the inputs for them, so they only need to work with sections of the business they understand.
It is time to make this better.
To find out more or for help on how to take the next steps in simplifying your forecasting process, please contact David Newton (david.newton@trinitybridge.asia)


