 The budgeting and forecasting process for most organizations is long and tedious and occurs on an annual basis, at least.
Companies try to do it more often to improve accuracy and aim to ultimately implement a procedure for continuous planning, rolling forecasts, and driver-based planning.
Unlike any other business process, budgeting and forecasting is unique because it is forward thinking. Business processes like accounting, inventory tracking, invoicing, shipping, etc. are based on actual events from the past and present.
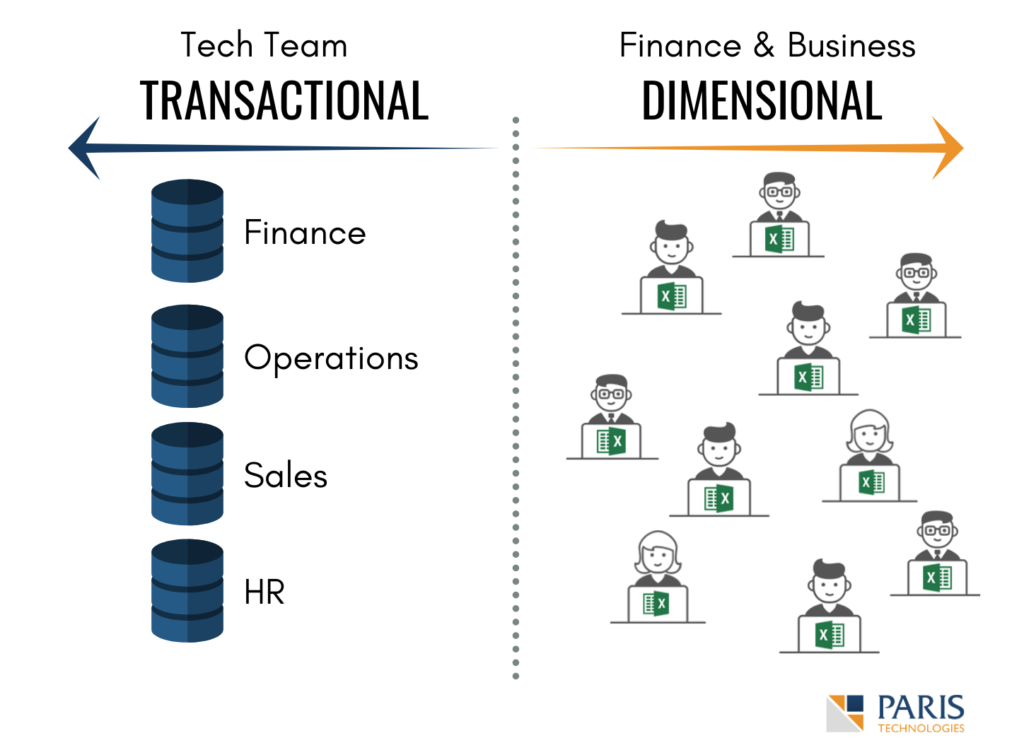
This is a fundamental difference as it also defines how the data from these processes are managed. Essentially, actual events are captured as transactions in ERPs, supply chain systems, invoicing and accounting systems, etc., and data related to it is effectively stored in its databases. On the other hand, budgets and forecasts typically reside in spreadsheets where aggregate data is entered by several people in the organization.
Every financial planning process is different for each company, which is why users prefer Excel as it provides the flexibility and customization they need. However, spreadsheets fail to meet the standards of collaboration needed to make the process more efficient.
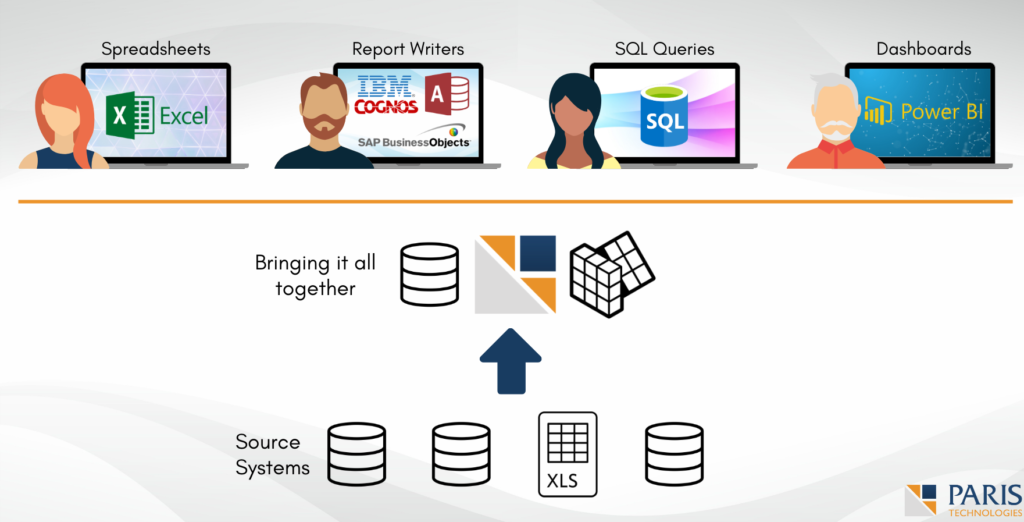
What does this mean for BI? BI tools especially user-facing ones such as dashboards and data visualization tools are great at capturing historical data. Tools such as Tableau, Qlik, PowerBI, and others have robust features that allow direct connection to systems that contain transactional data and create stunning dashboards that effectively draw out insights from its users. However, due to the nature of plans and forecasts, organizations struggle to integrate and represent these data in end-user BI tools.
At PARIS, we believe that in order to have a truly complete vision of your business that enables users to make better informed decisions, it is necessary to blend actual transactional data with budgets and forecasts. This led us to form the concept of Visionary Intelligence. We want leaders to manage their businesses not just from the historical standpoint that traditional BI delivers, but from a combination of historical and future data, which serves as a guide to the future they envision for their organization.
What is Visionary Intelligence?
A guidance system that enables you to drive your business with information not just from the past (what traditional BI delivers), but also with your plans and forecasts to direct a path towards the future you envision.
Integrating plans and forecasts in BI dashboards and data visualizations can be challenging, but possible. Here are some of the main considerations organizations need to think about when doing so:
Dynamic budgets and forecasts
As companies move towards generating rolling budgets and forecasts, uploading an Excel spreadsheet containing the latest version of the budget is a step away from efficiency. A static dashboard reflecting a spreadsheet report will be irrelevant just as quickly as the dashboard becomes available to its users. By then, it is likely those plans have already changed in the spreadsheet to adapt to the current state of the business. Therefore, dynamic connection to the spreadsheets needs to be established.
Collaboration in Excel
Let’s face it, business users love Excel, especially Finance professionals. They have become experts in spreadsheets, building complex financial models for their organizations and using their skills as an advantage through out their careers. In order to establish a dynamic connection with a living spreadsheet, the system must also address the need for multiple plan collaborators to access and input plan data simultaneously.
There is more to collaboration than just co-authoring when it comes to plans and forecasts. There are several people involved in a financial planning process, and each one is responsible for a specific area of the business. These people have their own spreadsheets to work with which needs to be consolidates in a master spreadsheet. Therefore, an effective system must be able to provide access to a centralized spreadsheet that multiple users can access to through their familiar Excel interface, and have the data they input immediately reflect in their BI dashboards. Solving this will eliminate the need to have versions upon versions of the same spreadsheet.
Blending actuals with plans and forecasts
Preparing a dashboard for plans and forecasts is half the challenge. For users to drive valuable insights, planning and forecasting data needs to be analyzed together with actual data. Both data must be blended together to provide end-users the freedom and flexibility to create ad-hoc data visualizations that display actual transactional data side-by-side with plans and forecasts.
Integrating plans and forecasts in BI projects is one of PARIS’ expertise. With our technology, we are able to build Metrics Engines for 3rd party BI systems to handle this case, and more such as custom formula calculations, automatic aggregation, integration, consolidation, and more. If you are working on a BI project and feel like you are bumping into some limitations of your dashboard or data visualization tool, checkout ourMetrics Engine for BI.


